Hidden Magic Commands in Databricks Notebooks
If you're working with Databricks notebooks, you're probably familiar with basic magic commands like %sql, %python, and %run. But there's a whole world of lesser-known commands that can dramatically improve your productivity and debugging workflow.
Let's explore the hidden gems that can transform how you work with Databricks notebooks.
Discovering all available magic commands
Before we dive in, here's how to see every magic command at your disposal:
%lsmagic
This reveals an extensive list of commands (some inherited from the Jupyter ecosystem).
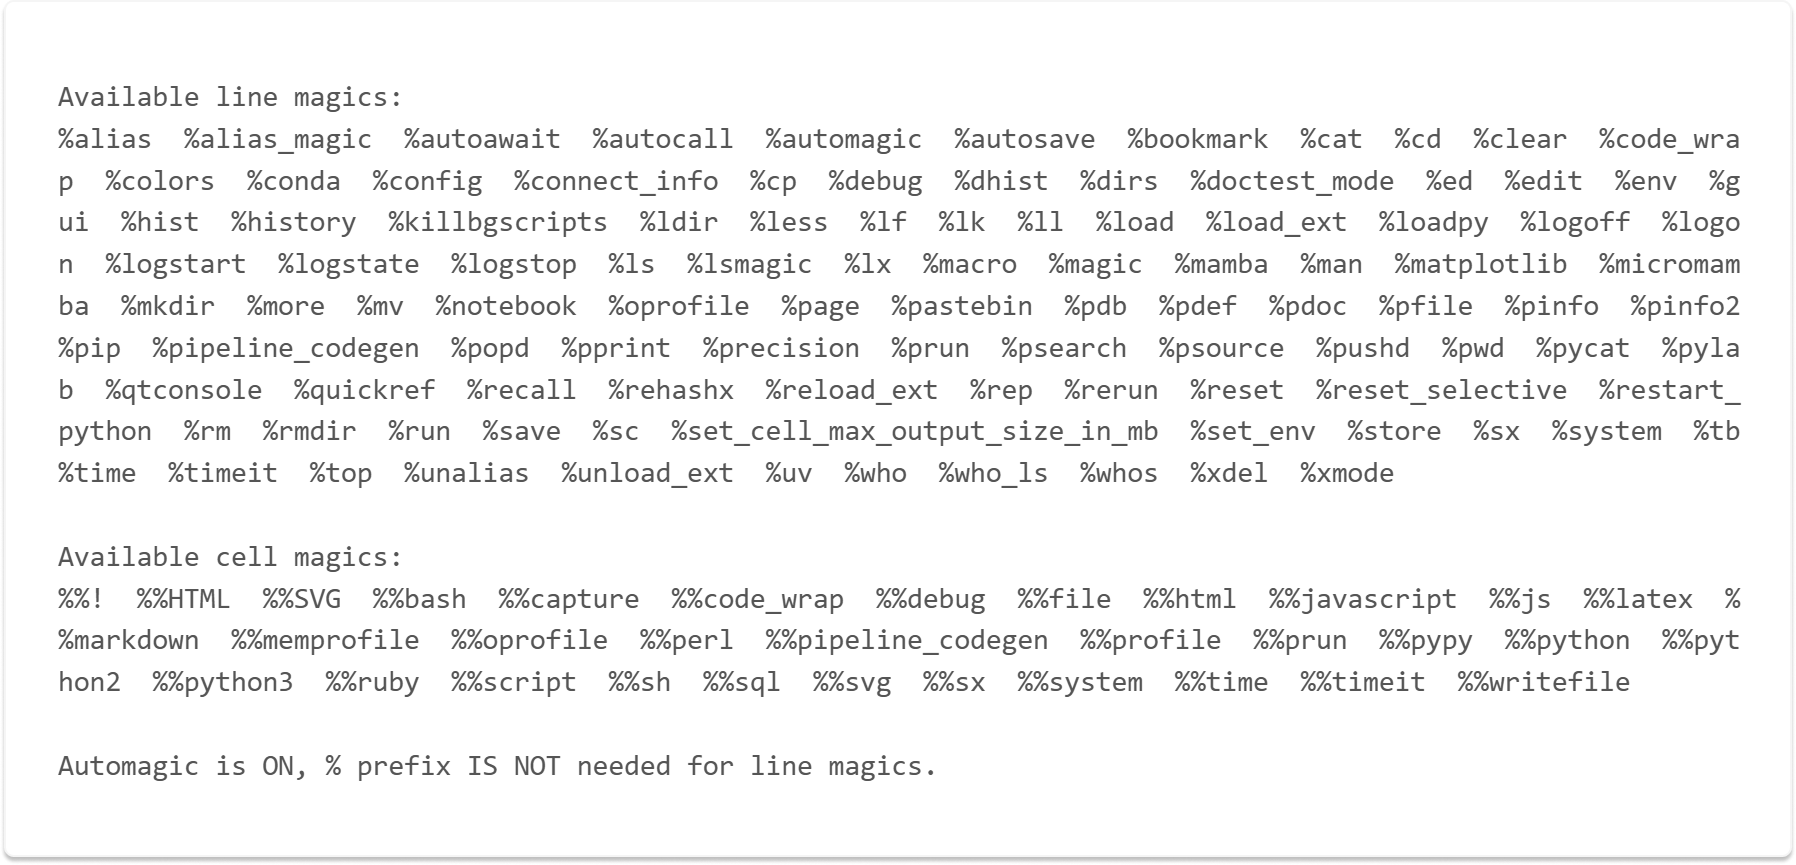
While not all of them work in Databricks (some are Jupyter-specific), the ones that do work are incredibly useful. Here’s a list of 12 of them.
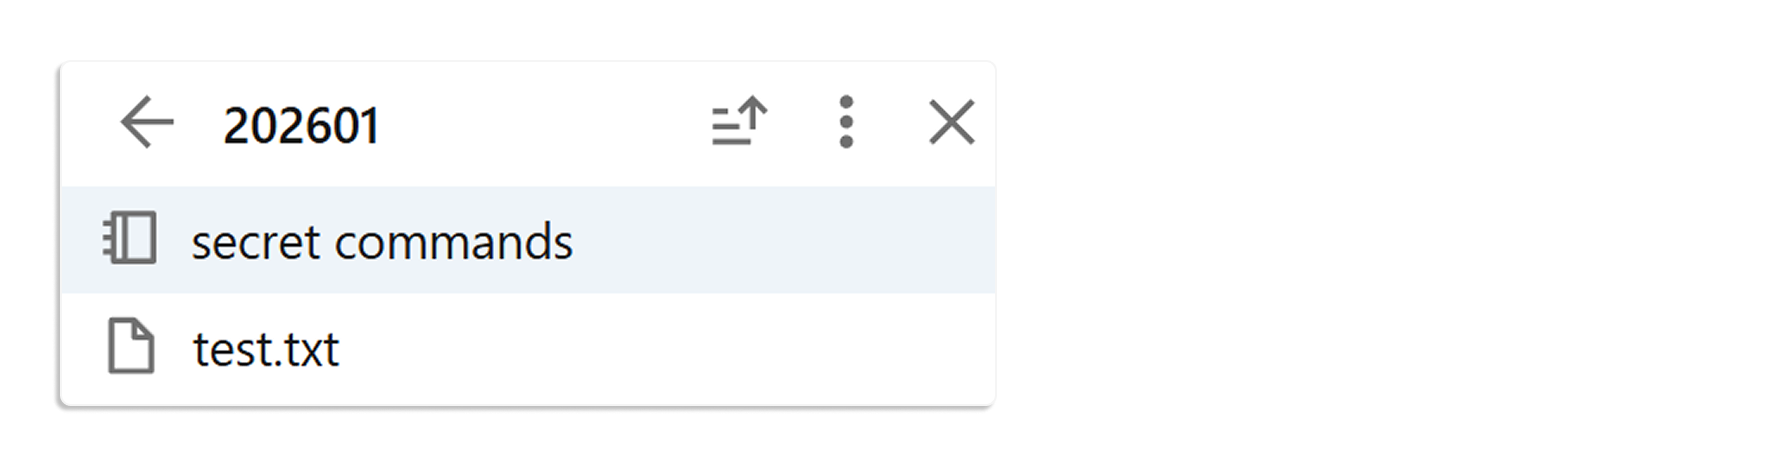
1. Write and Read Directly in Your Workspace
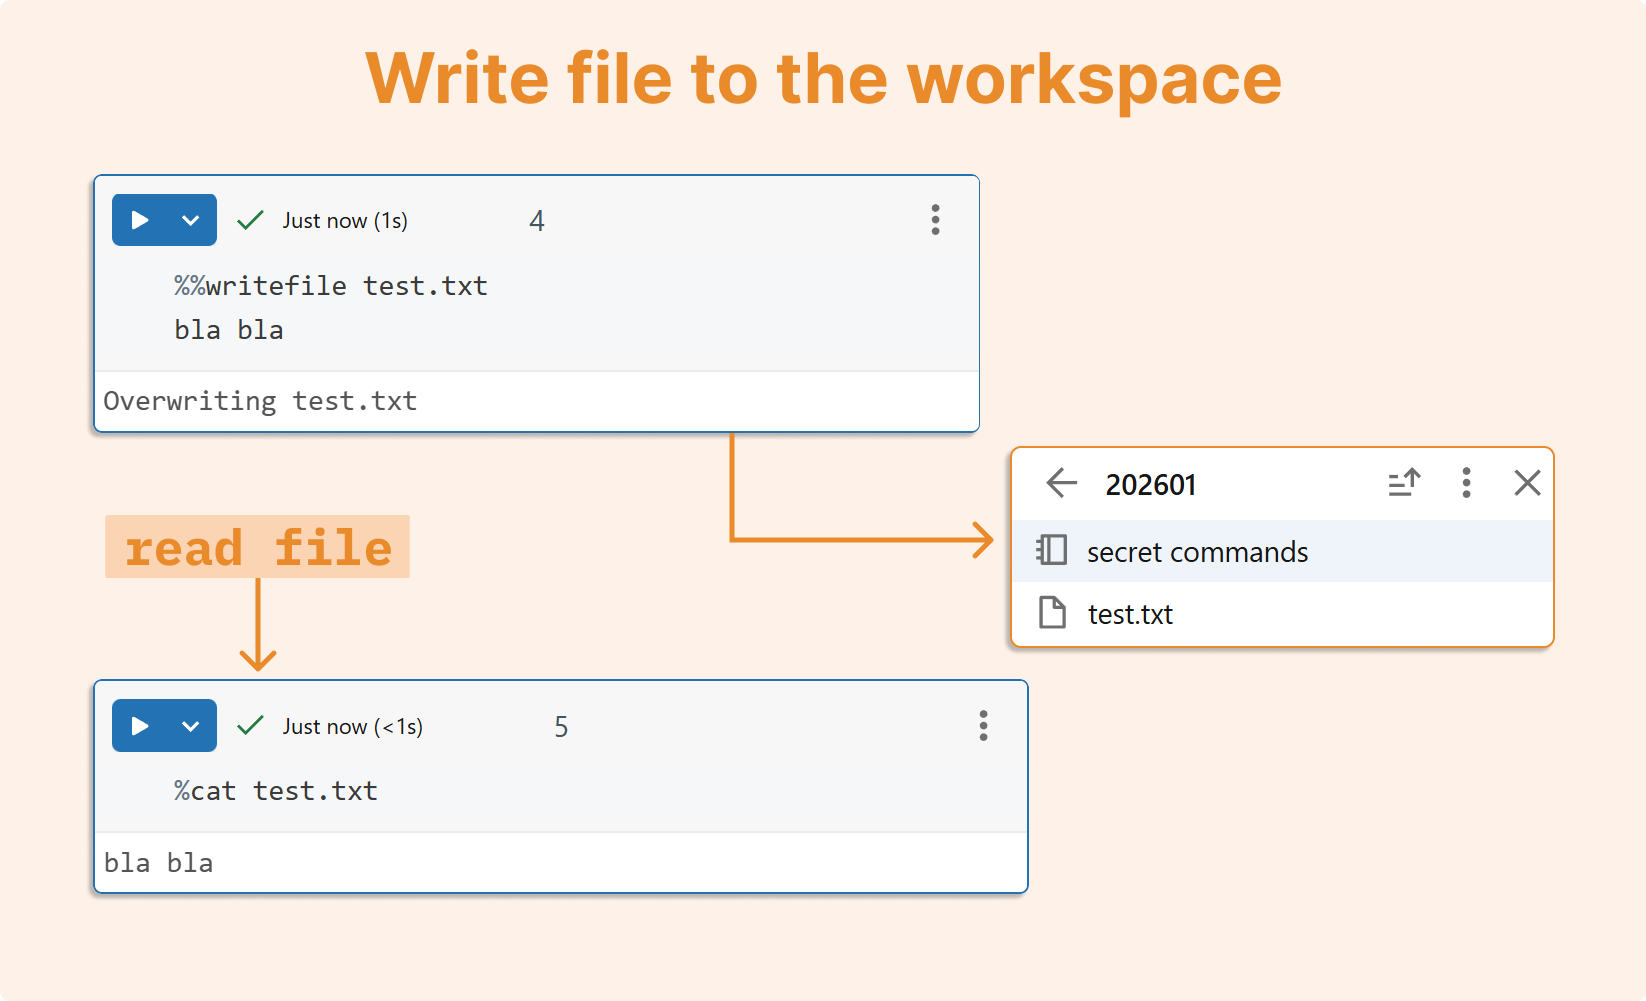
One of my personal favorites is %%writefile which lets you create files directly from notebook cells:
%%writefile test.txt
bla bla
The file is instantly saved to your workspace.
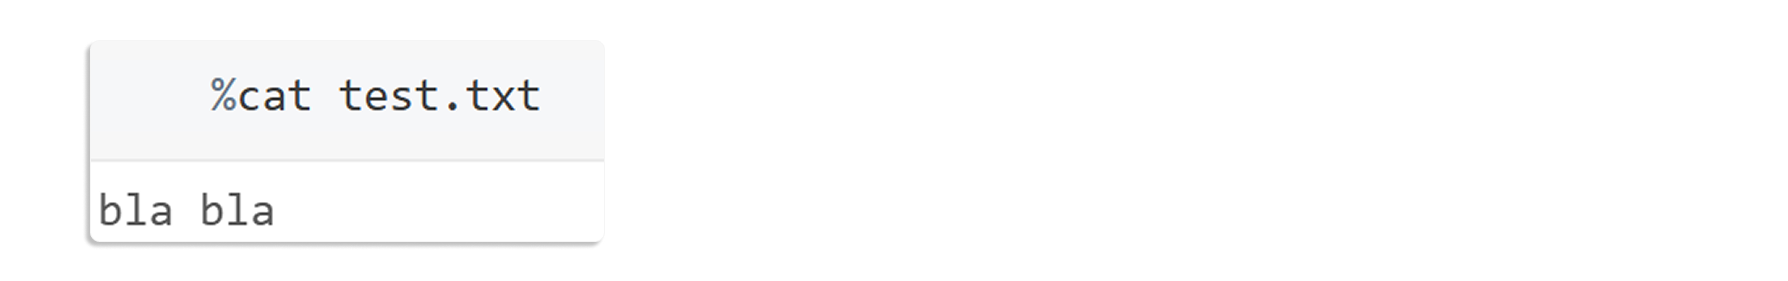
To read it back, use the %cat command:
%cat test.txt
Output of the above code:
This simple workflow is perfect for quickly creating configuration files, sample data, or documentation without leaving your notebook.
2. Performance measurement: track execution time
Understanding how long your operations take is crucial for optimization. Databricks notebooks offer two timing commands:
a. Single execution timing:
%%time
df = spark.range(10_000_000)
df.count()
Output of the above code:

b. Multiple execution benchmarking:
%%timeit
spark.range(1_000_000).count()
The %%timeit command runs your code multiple times and provides statistical analysis of execution times.
Output of the above code:

Please remember these considerations when timing Spark operations:
Spark has warm-up costs that affect initial runs
Lazy evaluation means transformations aren't timed until an action occurs
Caching effects can skew results in subsequent runs
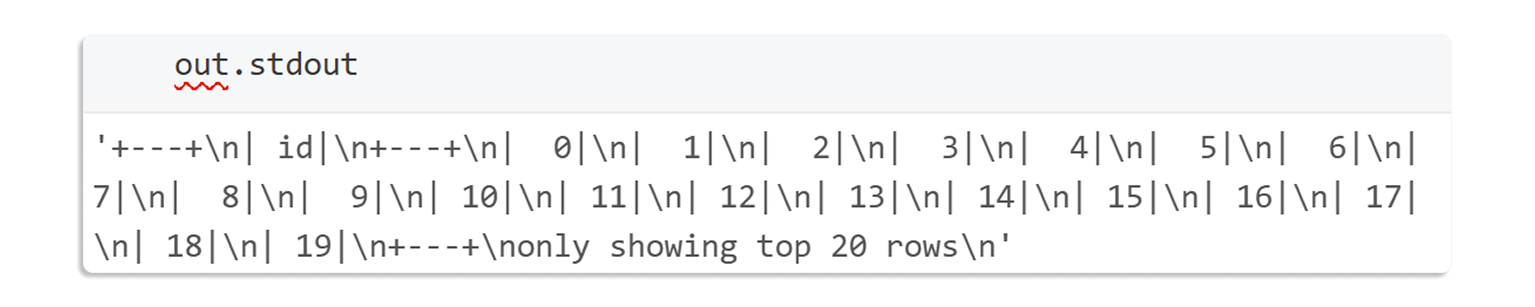
3. Capturing output: suppress and store cell results
Sometimes you need to run code without cluttering your notebook output, or you want to capture results for later processing. The %%capture magic command does both:
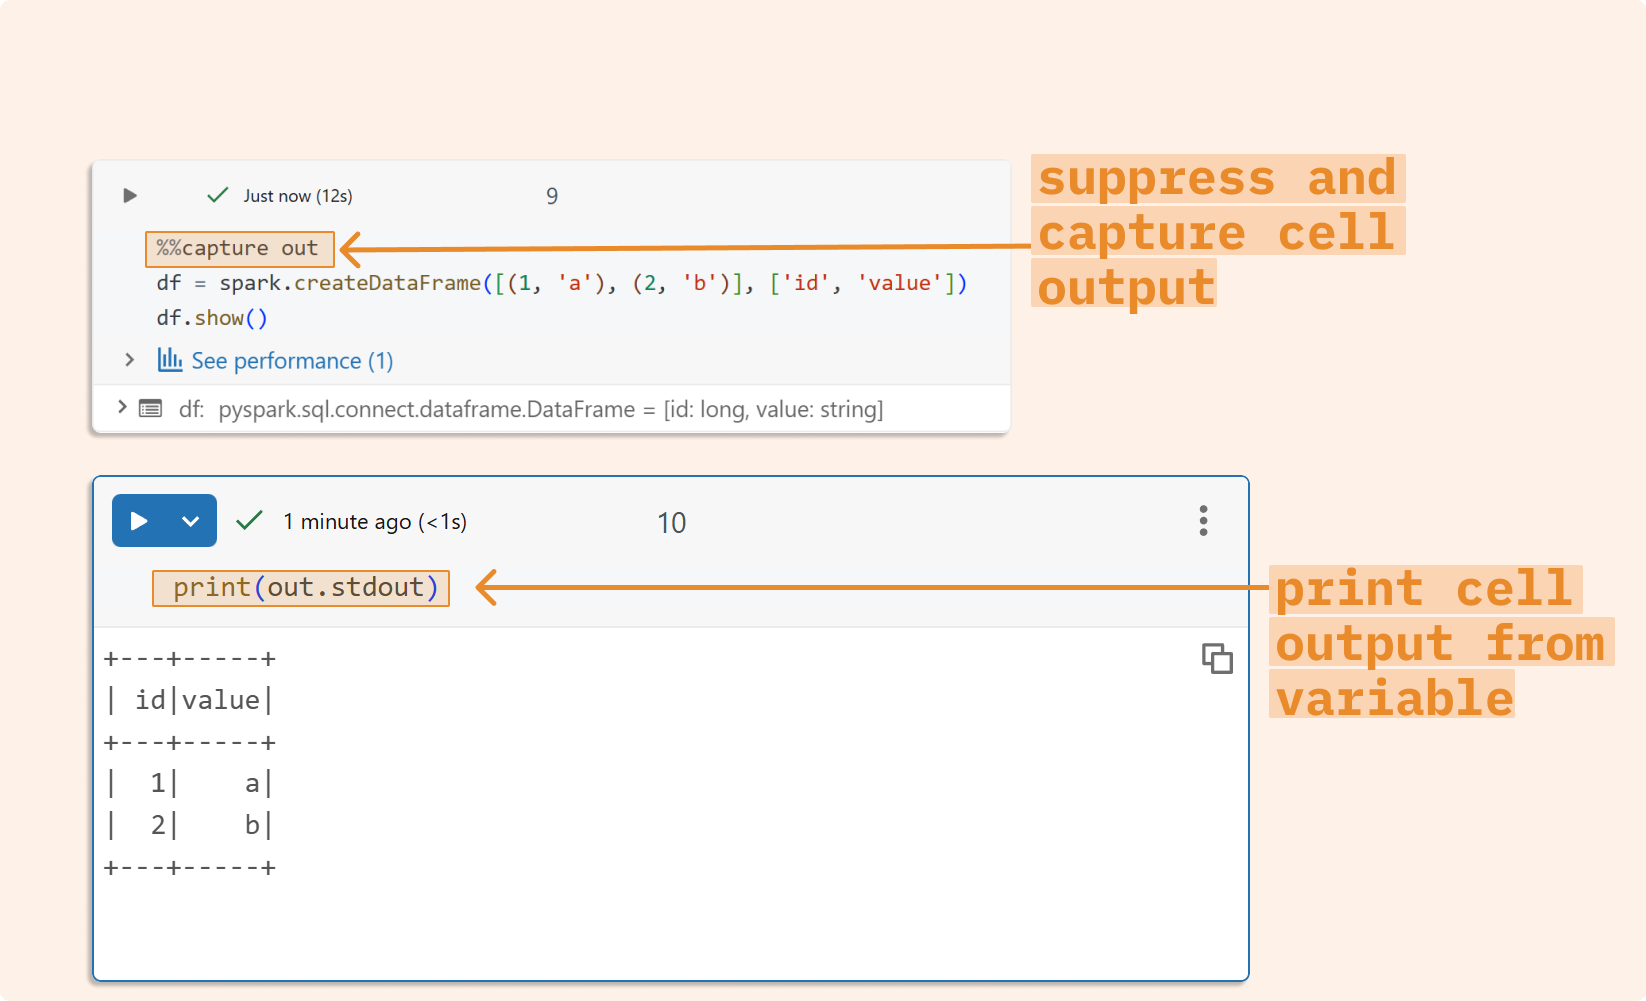
%%capture out
df = spark.range(1_000_000)
df.show()
The cell executes silently, and all output is stored in the out variable. You can then access it programmatically in subsequent Python cells.
4. Shell commands: direct access to the underlying system
Need to interact with the file system or run shell commands? Databricks notebooks make it easy:
%%bash
ls /Workspace/
Output of the above code:

For common bash commands, you can skip the %%bash prefix and use shortcuts. Instead of %%bash Is, simply write %Is:
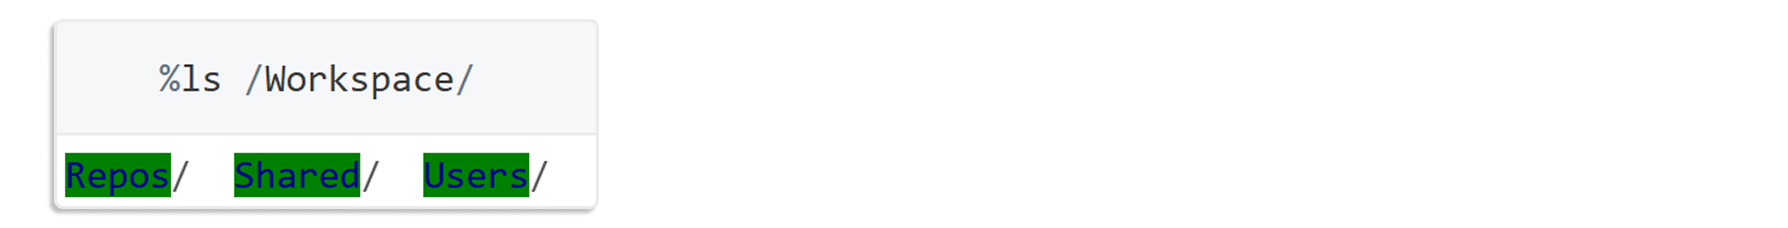
This shorthand works for most standard Linux commands and even gives you colorized output.
5. Bridging Shell and Python
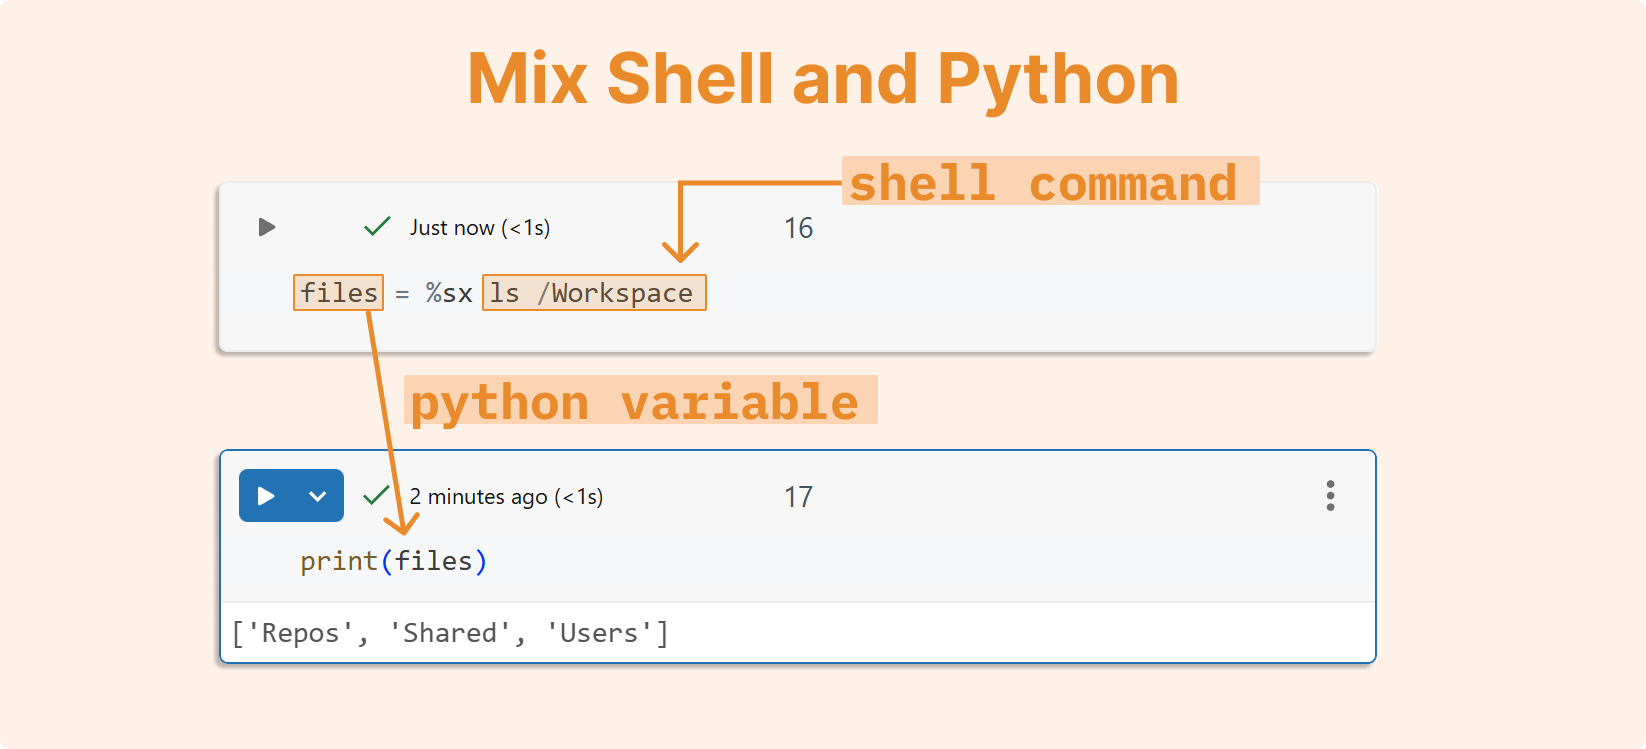
Here's where things get really interesting. You can redirect shell command output directly into Python variables using %sx:
files = %sx ls /Workspace
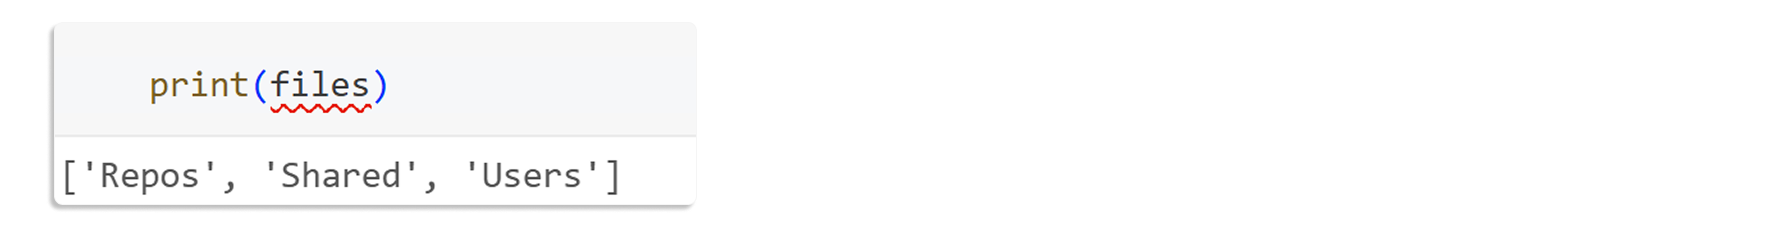
The files variable now contains the shell output as a Python list, ready for further processing. This integration between shell and Python is invaluable for automation and data processing workflows.
6. Cell output management
When working with large datasets or verbose operations, excessive cell output can freeze your browser or overwhelm your driver. Protect yourself by limiting cell output:
%set_cell_max_output_size_in_mb 1
This sets a 1MB limit on cell output, preventing accidental browser crashes from massive print statements.
7. Skip cells temporarily
Need to temporarily disable a cell without deleting it? Use %skip:
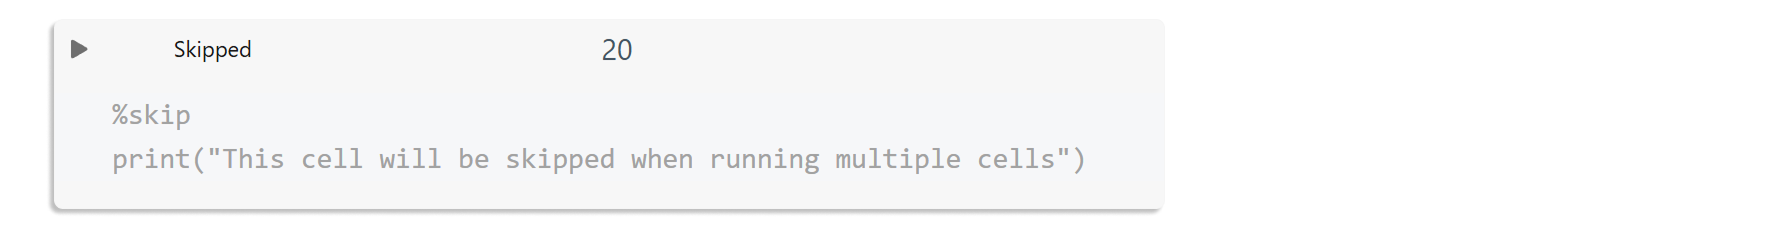
The cell appears grayed out and is skipped during notebook execution, making it perfect for debugging or temporarily disabling code blocks.
8. Variable inspection: see what’s in your workspace
Lost track of your variables? Use %who for a simple list or %whos for detailed information:
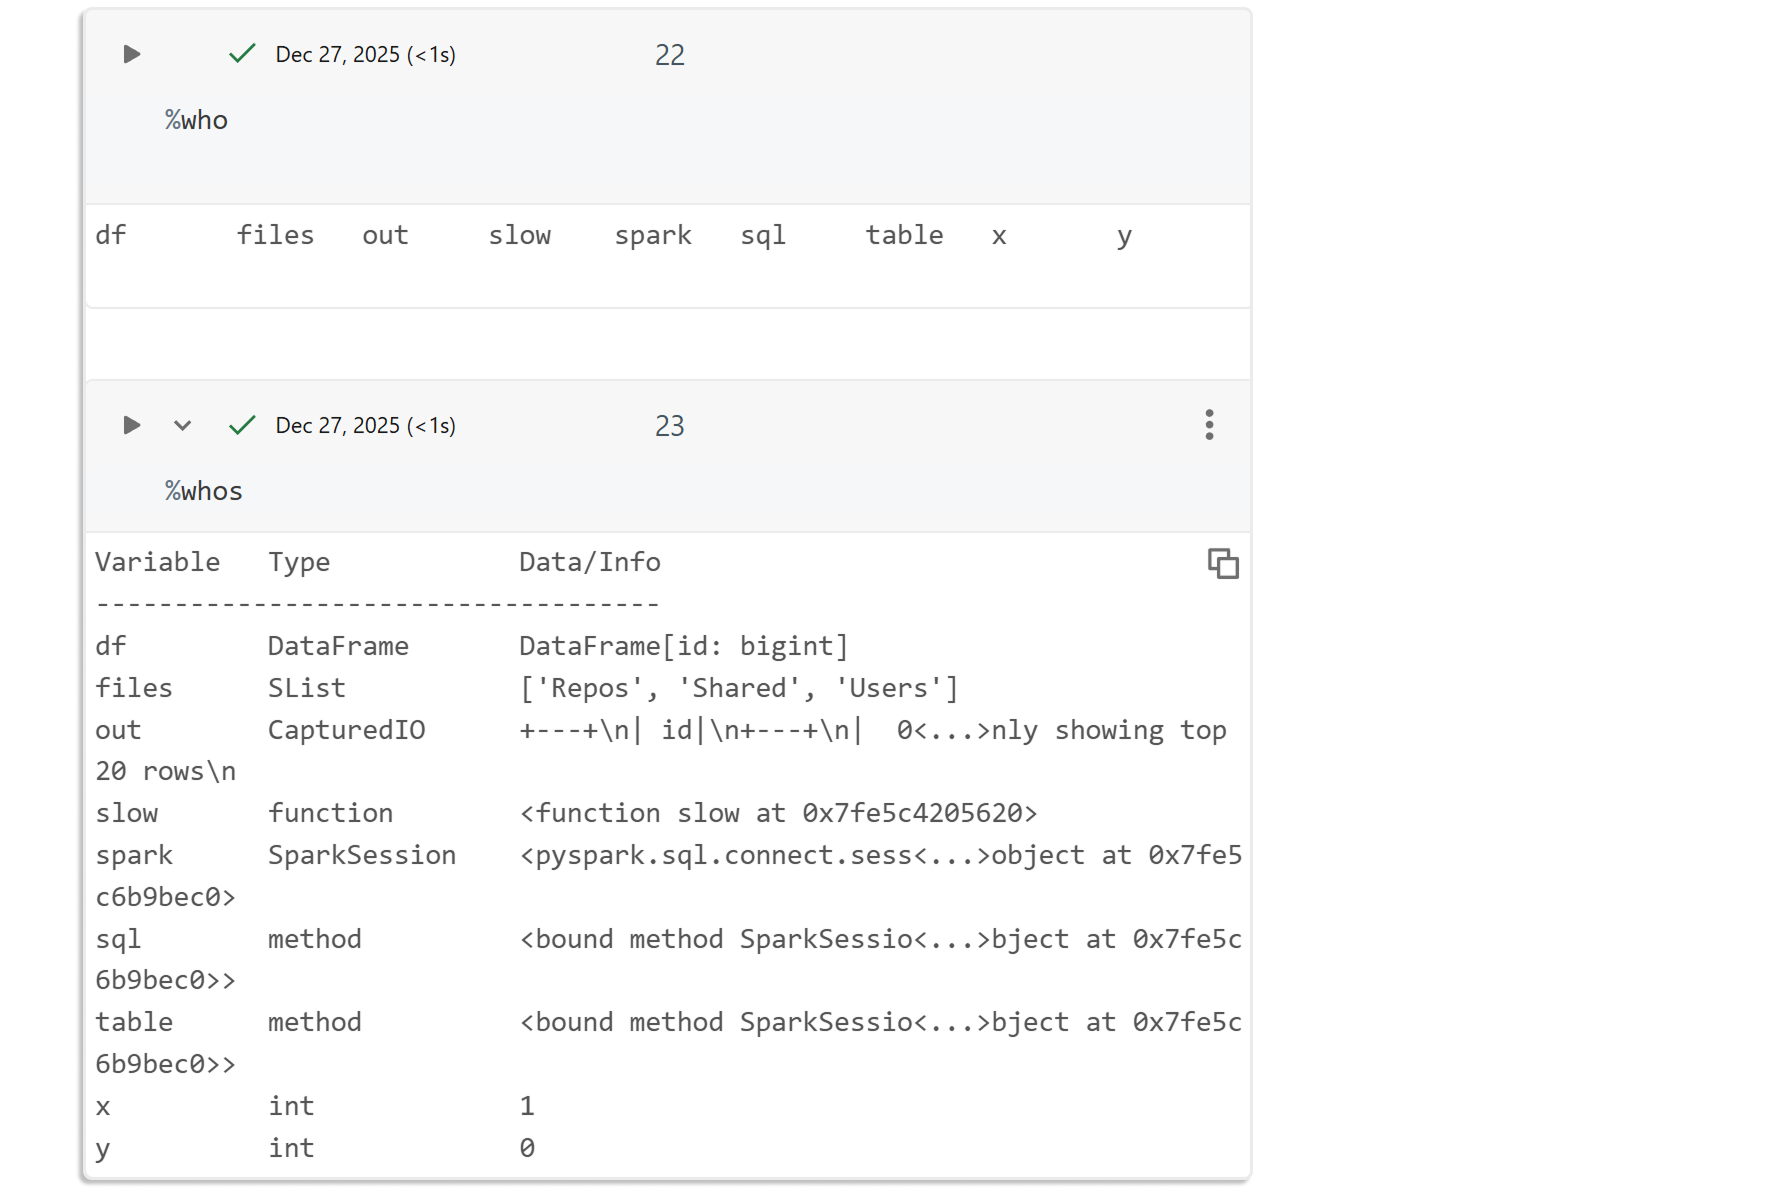
This displays all variables in your namespace along with their types and values.
9. Command history: review your execution path
The %history command shows you all the commands you've executed in the current session:
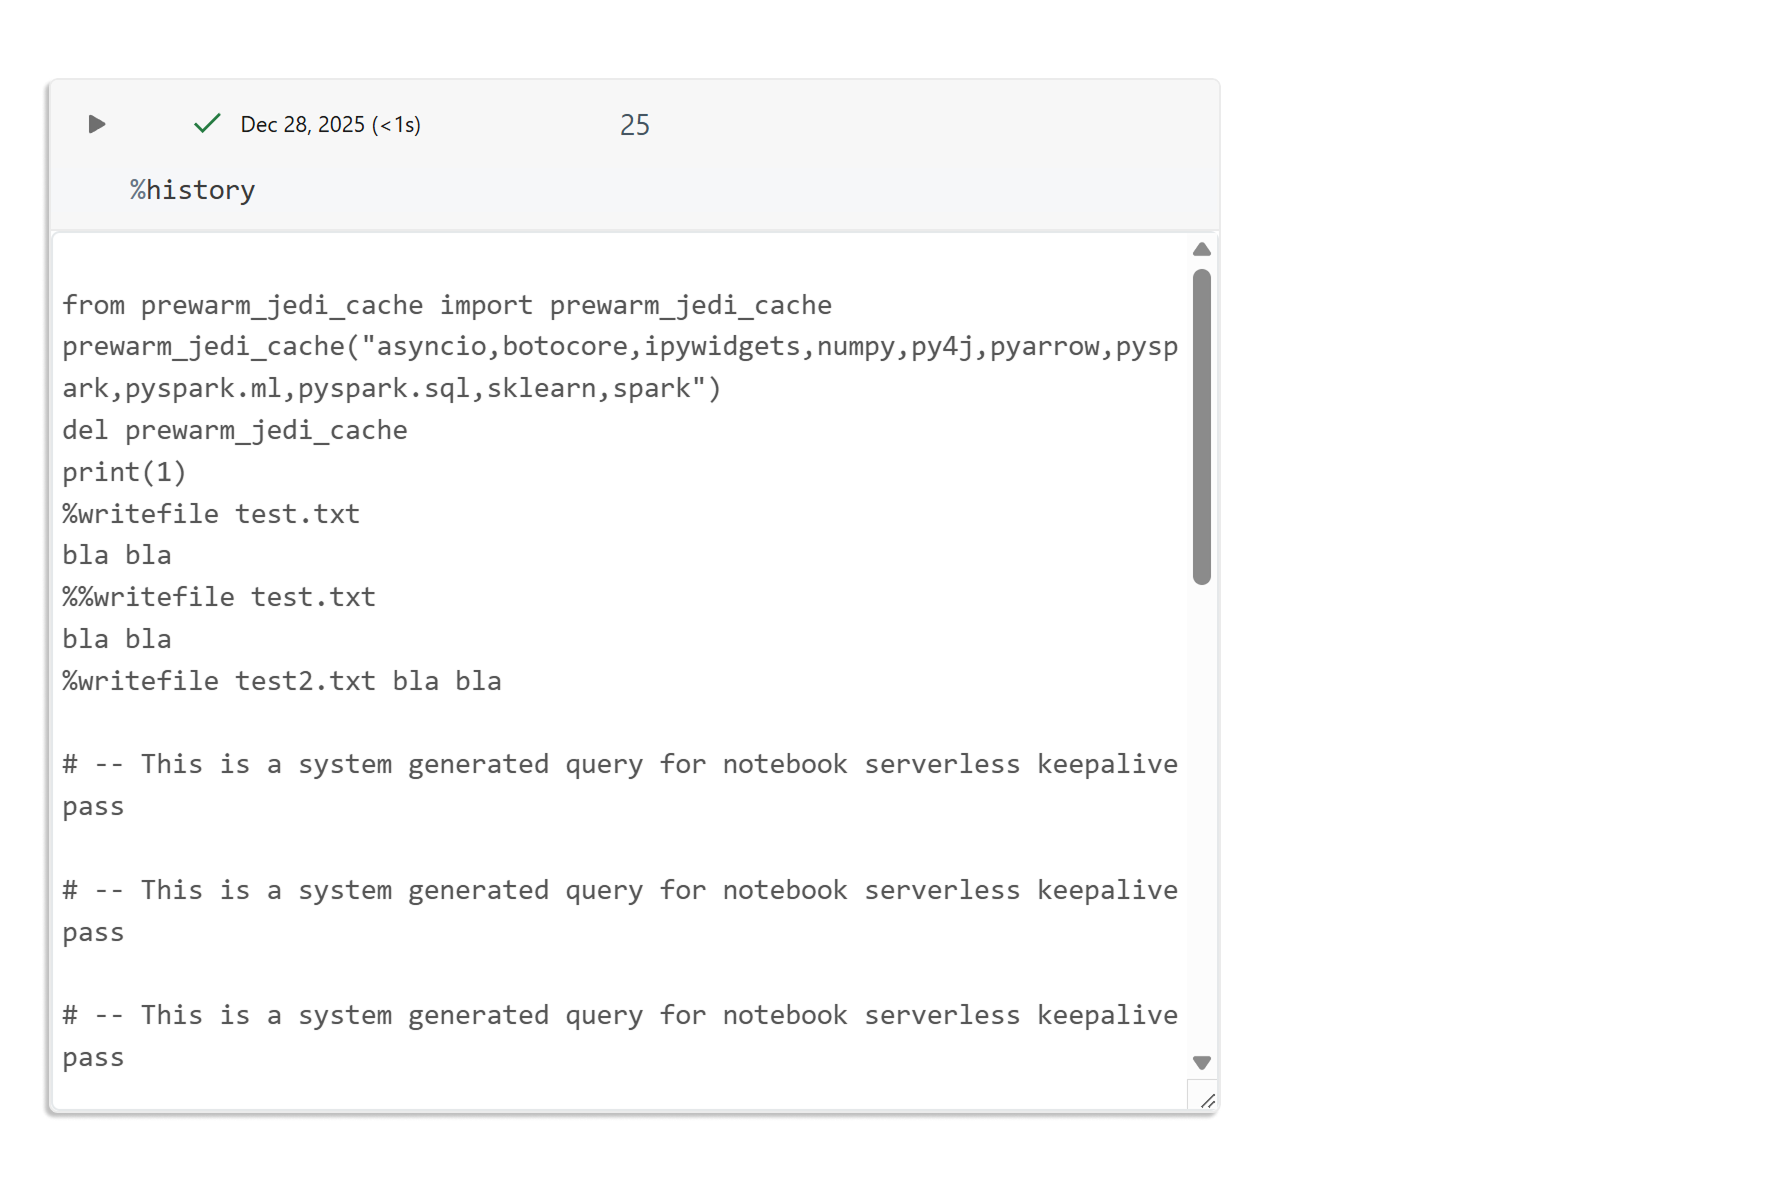
This is particularly useful when you need to retrace your steps or understand the sequence of operations that led to a particular result.
10. Session logging: capture everything automatically
For documentation or debugging purposes, you can quickly enable IPython logging by using %logstart, and it can be later stopped by using %logstop
%logstart -o -t ipython_log.py
%logstate
print("this will be logged")
%logstop
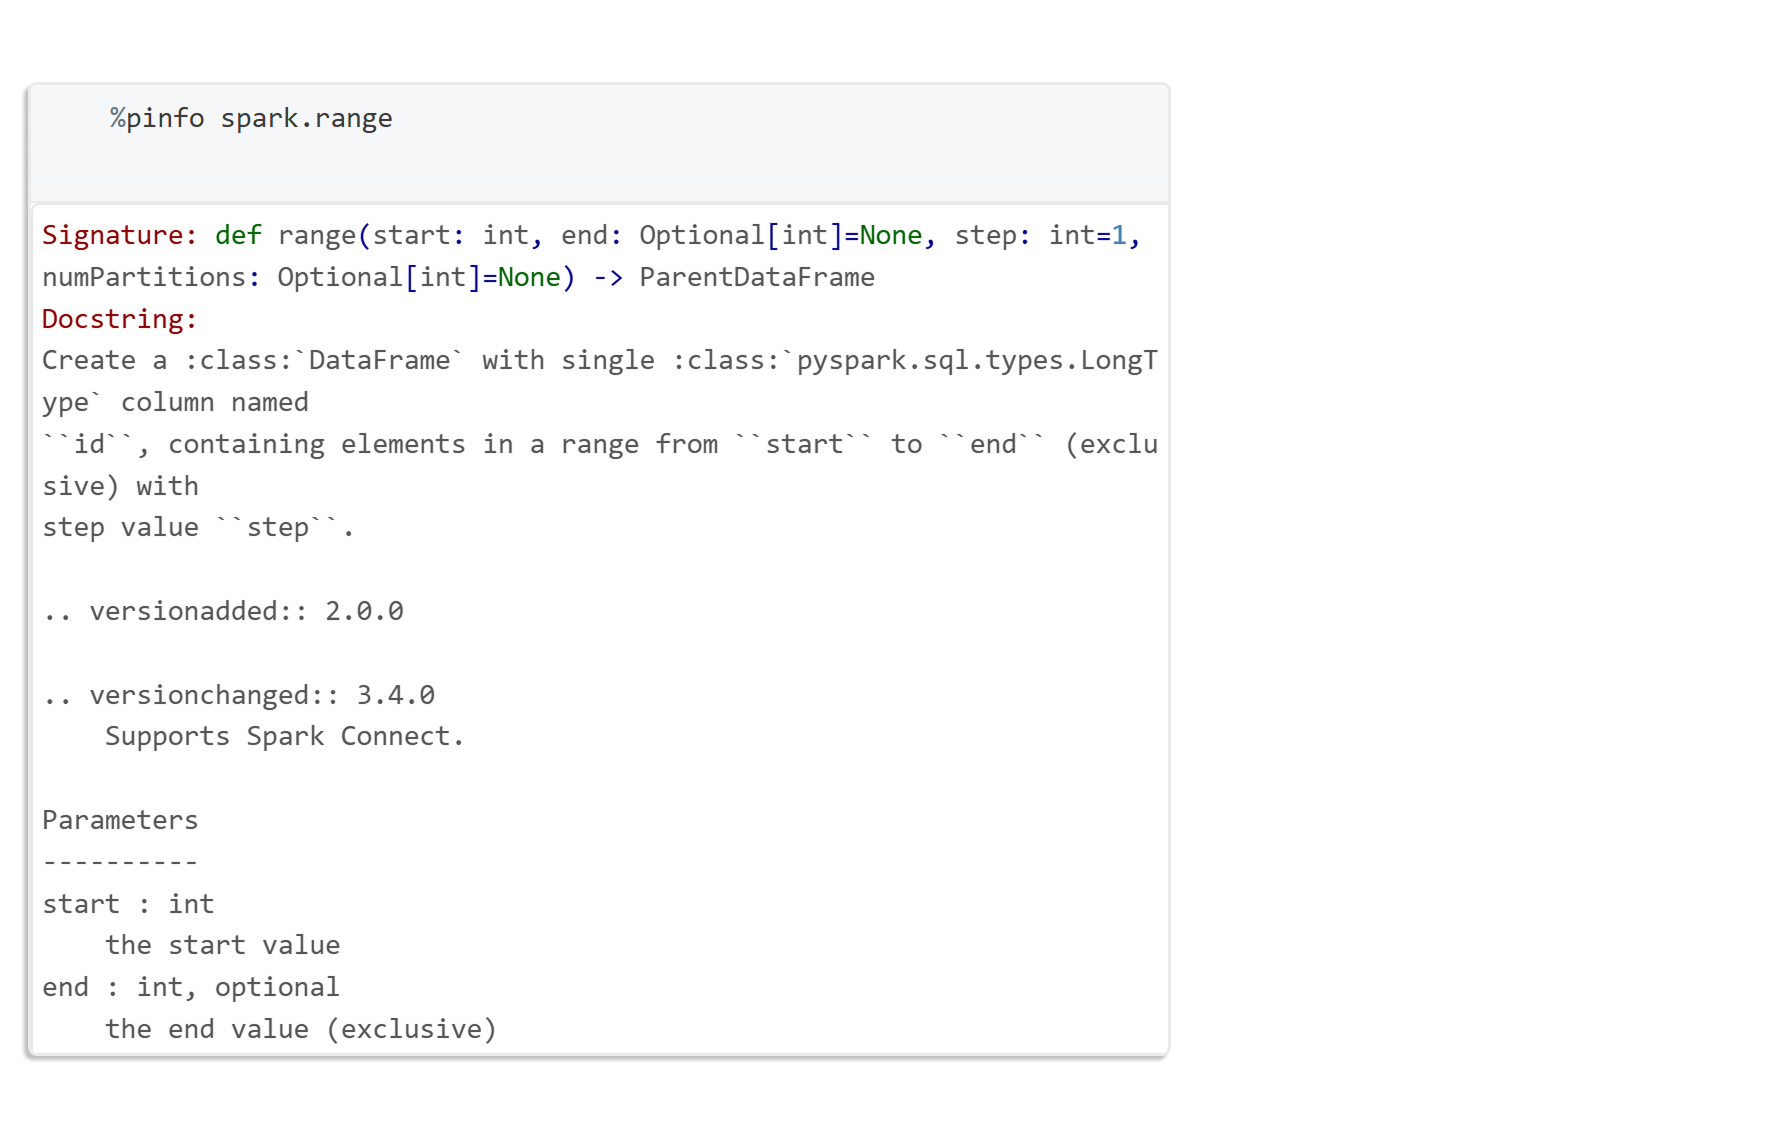
11. Documentation access: quick help for any object
%pinfo comes really handy and allows us immediate access to documentation. This provides immediate access to docstrings and method signatures, no need to switch to external documentation.
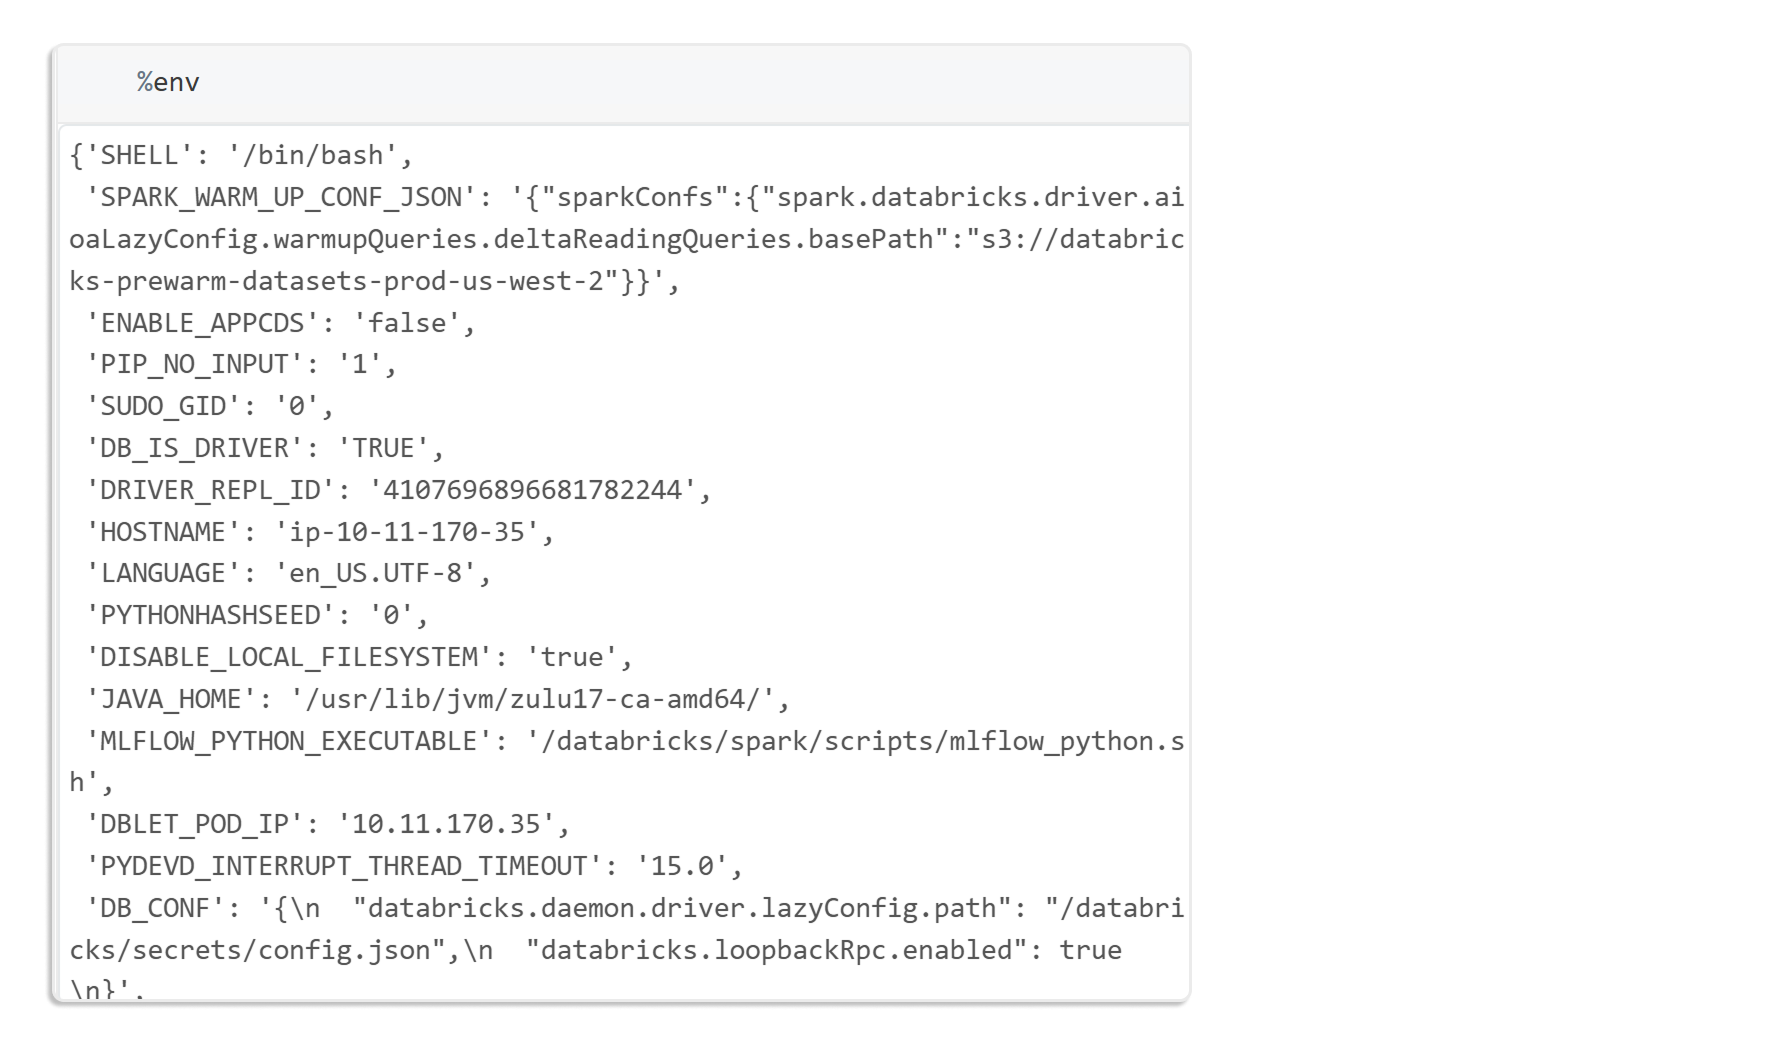
12. Environment variables: view and set configuration
Lastly, we often need to check current environment variables.
a. View all environment variables:
b. Set or view a specific variable:
%env MY_FLAG=1
%env MY_FLAG
Making the most of magic commands
These magic commands aren't just shortcuts; they're powerful tools that can streamline your workflow, improve efficiency, and provide deeper insights into your code execution. The key is to experiment with them in your daily work and discover which ones best fit your specific use cases.
Let us know which magic commands you are using. Are there any we didn't cover that have become essential to your workflow? The Databricks notebook environment is rich with hidden features; there's always more to discover.