In a recent project, I built Genie's semantic and business context layers around a sales model. This walkthrough uses a simplified version of that model to show how the components fit together in practice.
In Understanding Genie Ontology: How Databricks Builds Business Context, we covered the theory behind Genie Ontology and how its components work together. Here, we put those concepts into practice: we describe a table, create a metric view, organize it in a Domain, document its meaning in a Page, and assign certification after review.
The definitions are hypothetical and do not reproduce the project's business rules.
The interface shown in the screenshots may differ by workspace and feature availability.
Start with the business definition
We will use one question to connect the steps:
| Which region had the highest completed sales value in August 2026?
We start by agreeing on what “completed sales” means:
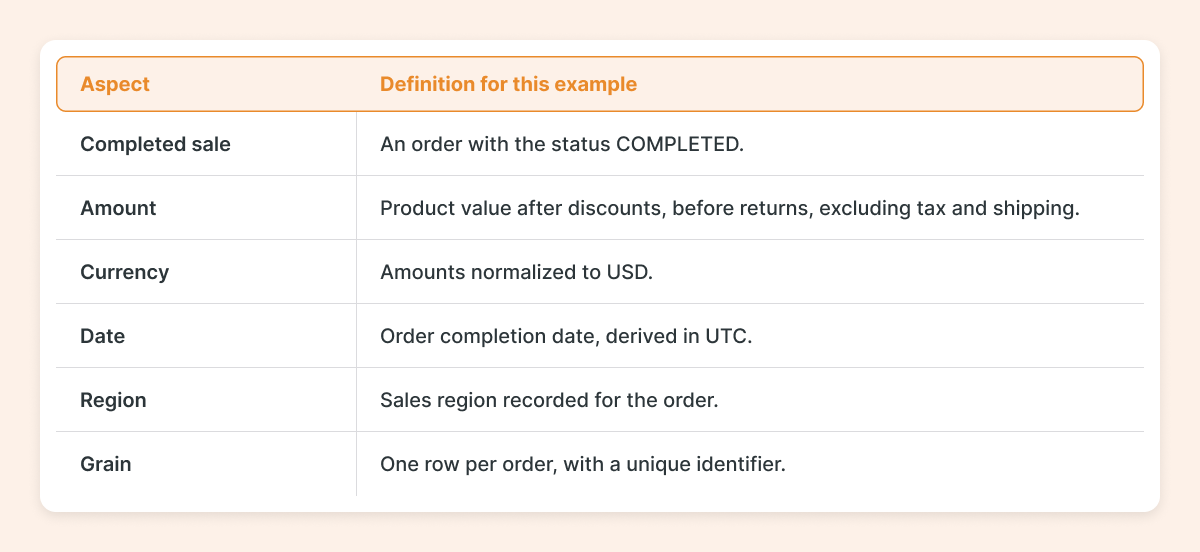
This measure does not represent accounting revenue or sales net of returns. Making that difference explicit helps prevent a question from using a calculation with a different meaning.
Metadata and relationships: describing assets
Table and column metadata give an initial explanation of what the data contains. A useful description adds information: what one row represents, what an amount includes, or which event a date refers to.
For this walkthrough, we use an existing demo.sales.orders table. We assume one row per order, standardized statuses, non-null decimal amounts, and a region and completion date for each completed order. Prepare the source data before following the steps.
We open Catalog and navigate to demo → sales → orders. In the Overview tab, we review the AI-suggested description and use Edit to make it match our definition before saving:
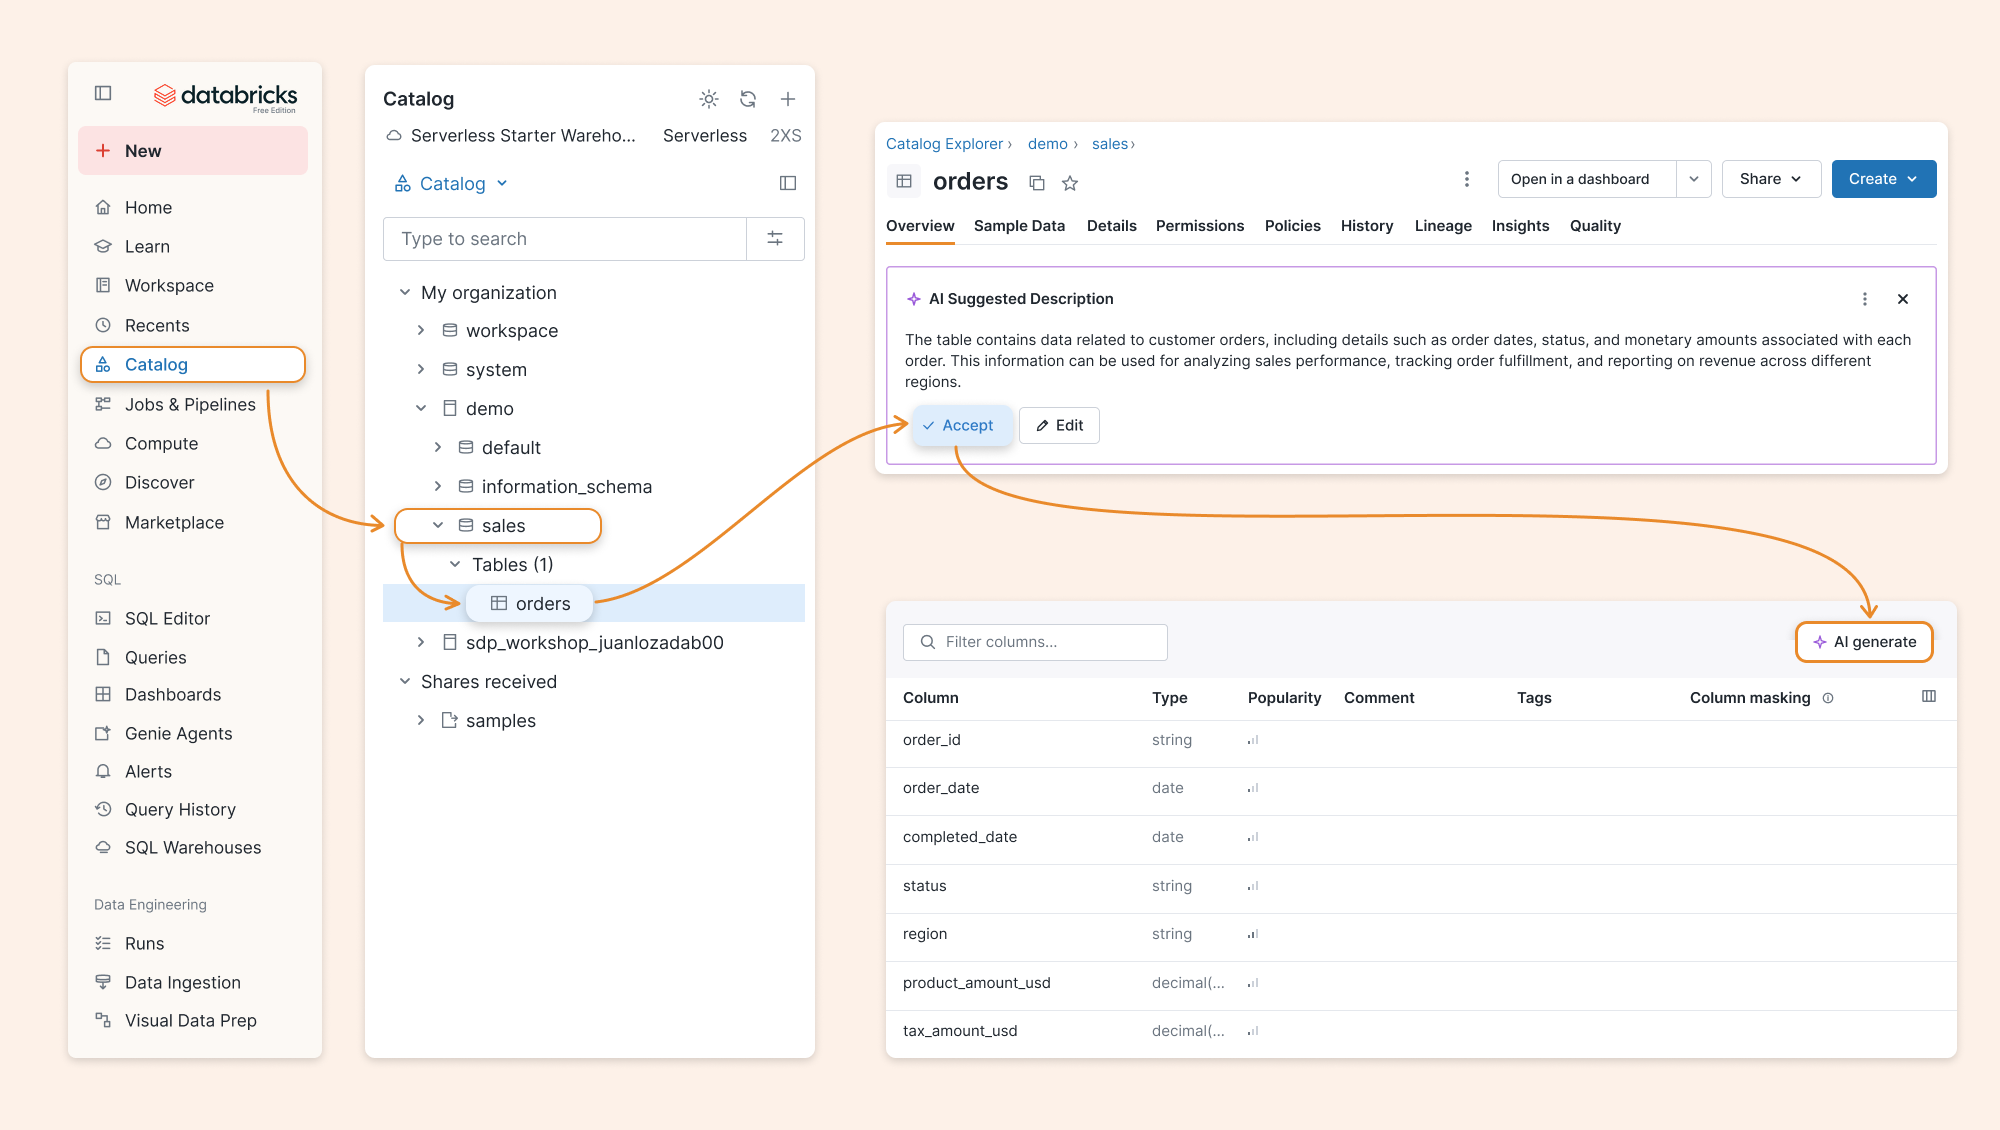
Next, we select AI generate above the column list. In the Edit column comments, we review each suggestion against the meaning of the data:
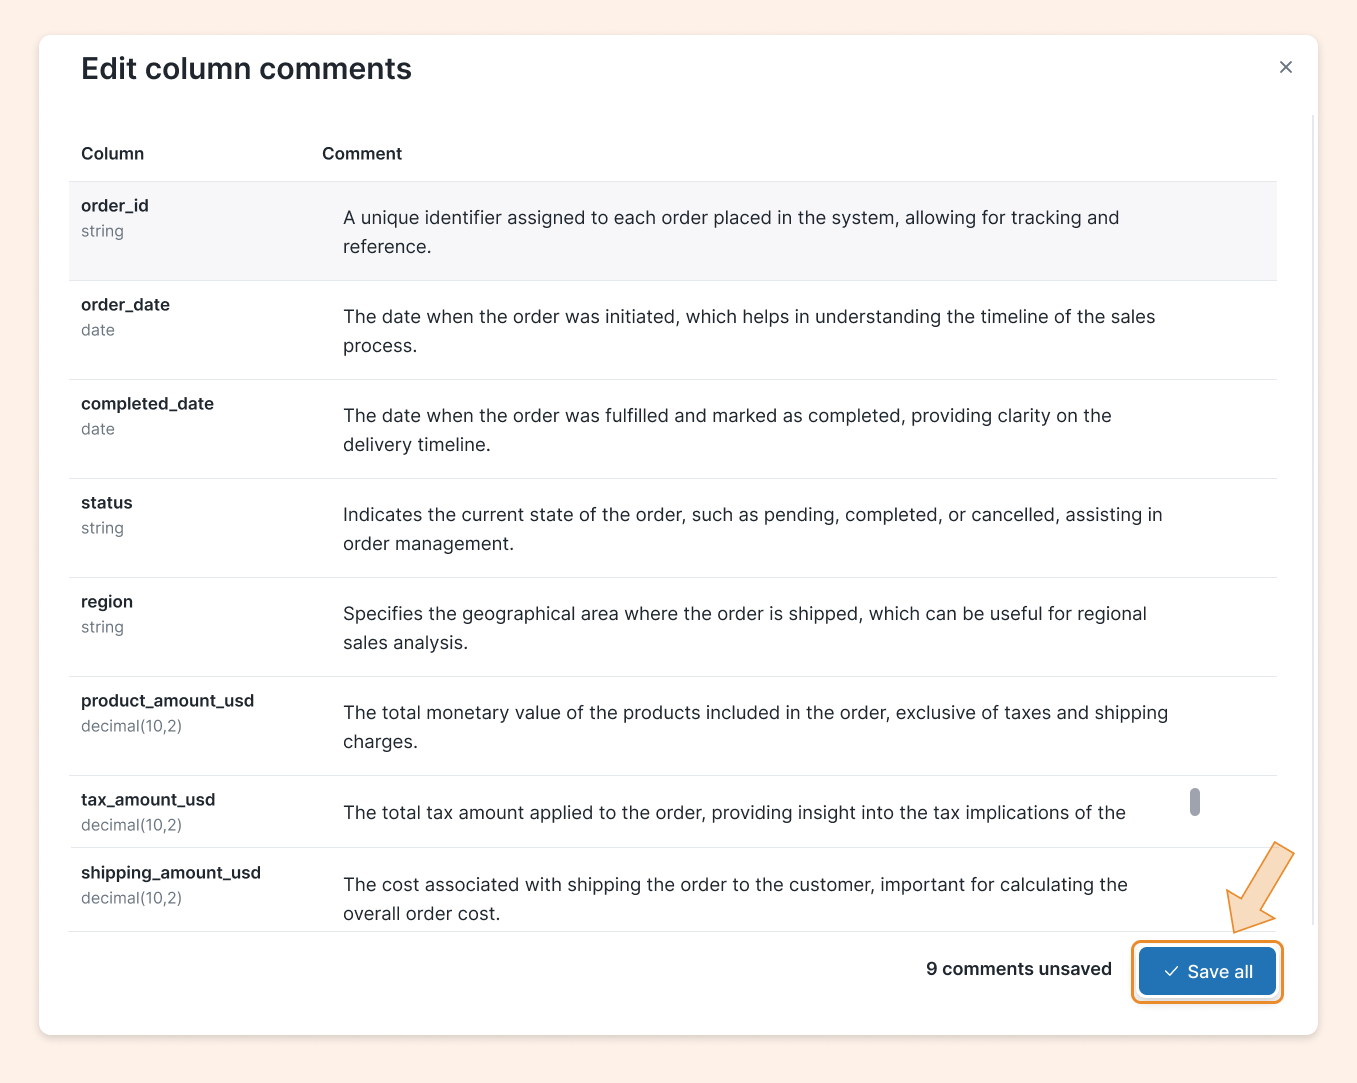
Once the comments are accurate, we select Save all.
The suggestions in my demo make the need for review visible. The generated comment describes region as the shipping area, while our example defines it as the sales region. The completed_date suggestion also refers to delivery. We need to check those meanings against the data before saving.
A column name cannot settle this kind of business context. AI gives us a starting point; we still need to decide whether the description is accurate. Once reviewed and saved, the comment becomes explicit metadata.
Relationships need the same care. In Databricks, primary and foreign keys are informational: declaring them does not automatically check uniqueness or referential integrity. Describing one row per order does not enforce that grain either. We still need to validate the source data.
Metric views: expressing meaning through a calculation
For completed sales, we need a shared amount calculation and fields for region and completion date. We can also add comments, display names, synonyms, and formats. A synonym should preserve the meaning: “completed order value” fits our example, while “net revenue” could imply different rules.
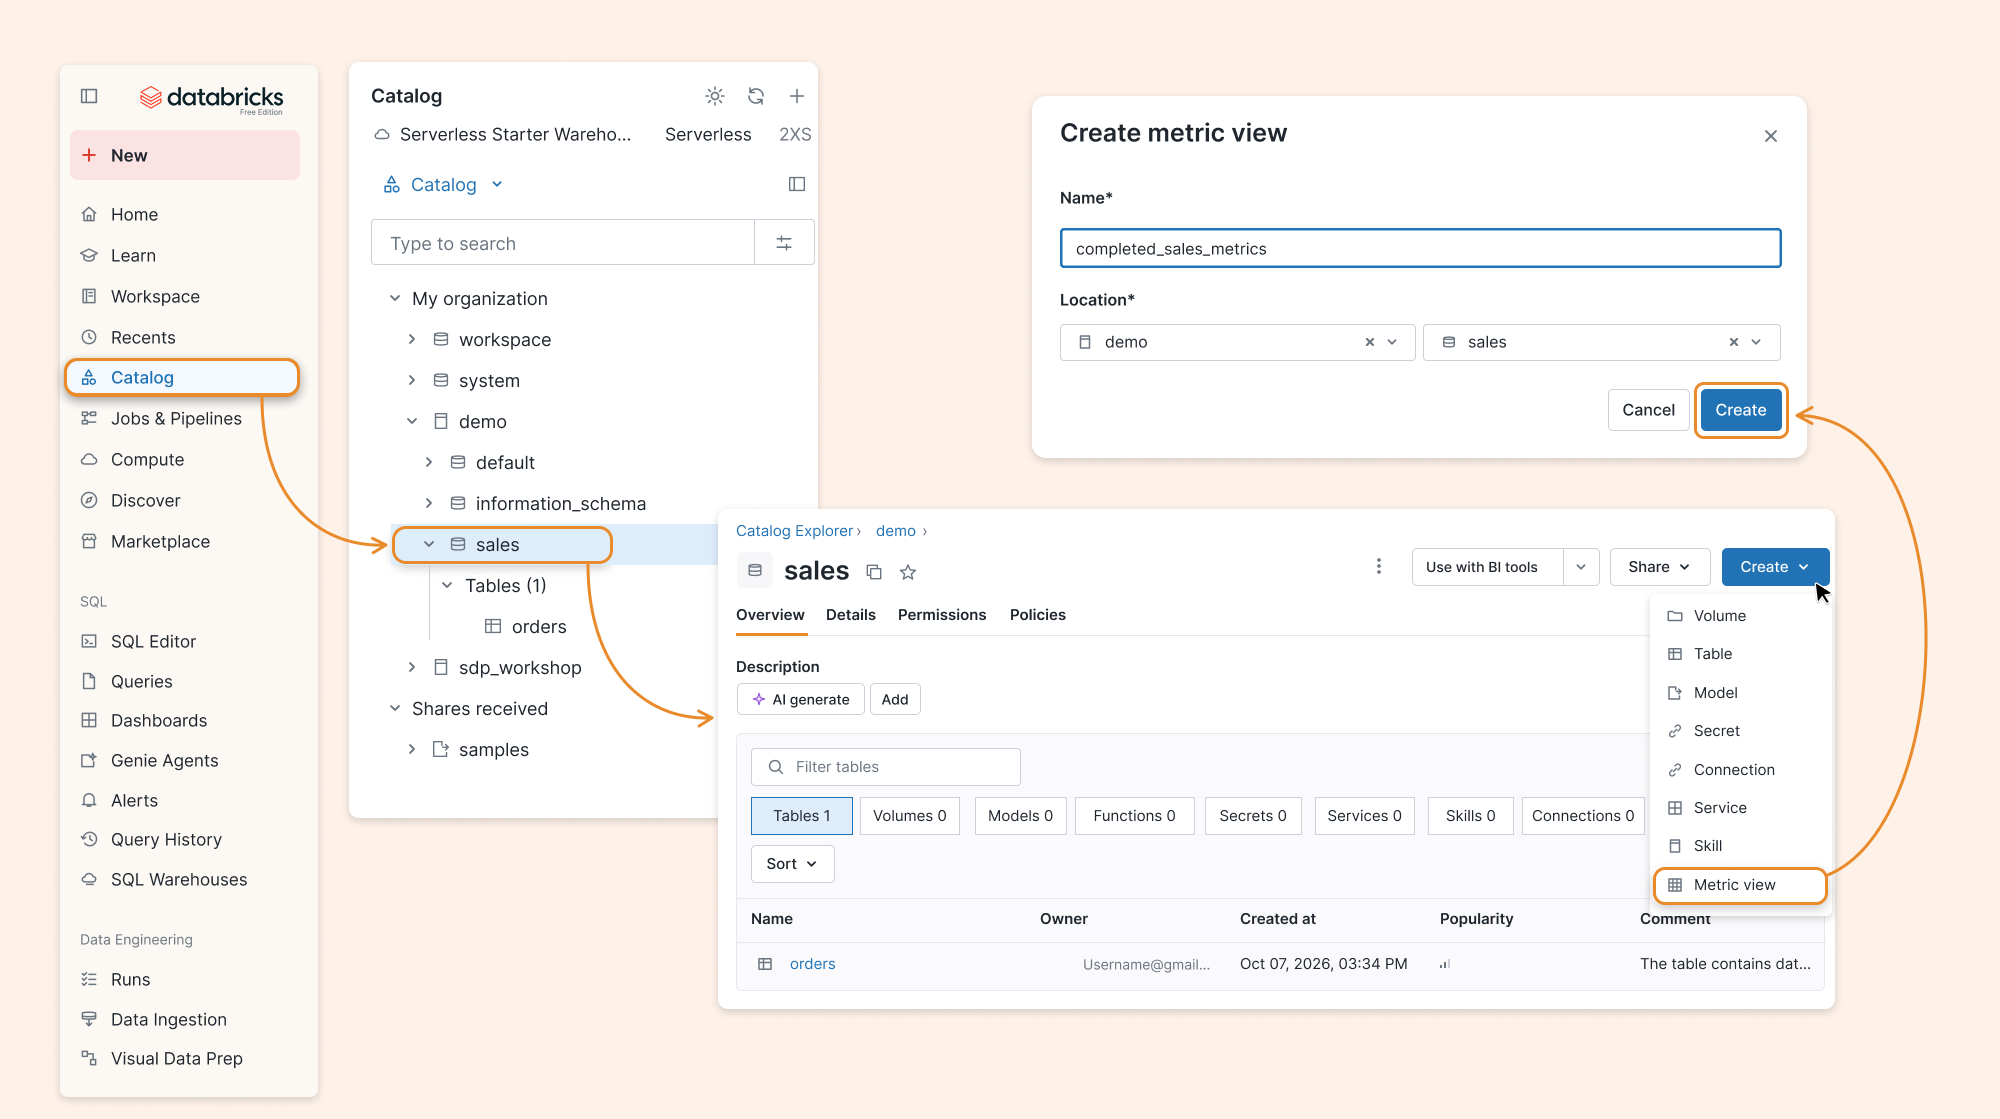
In Catalog, we open the sales schema under demo and select Create → Metric view. We enter completed_sales_metrics, confirm demo and sales as the destination catalog and schema, and select Create. We need access to the source, permission to create the view in that schema, and access to suitable compute.
In the editor, we select the <> button to define the metric view in YAML. The highlighted sections show three parts of the definition:
Source and filter: specify where the data comes from and which rows to include.
Fields: define the attributes available for grouping and filtering.
Measures: define the aggregate calculations used to produce the metrics.
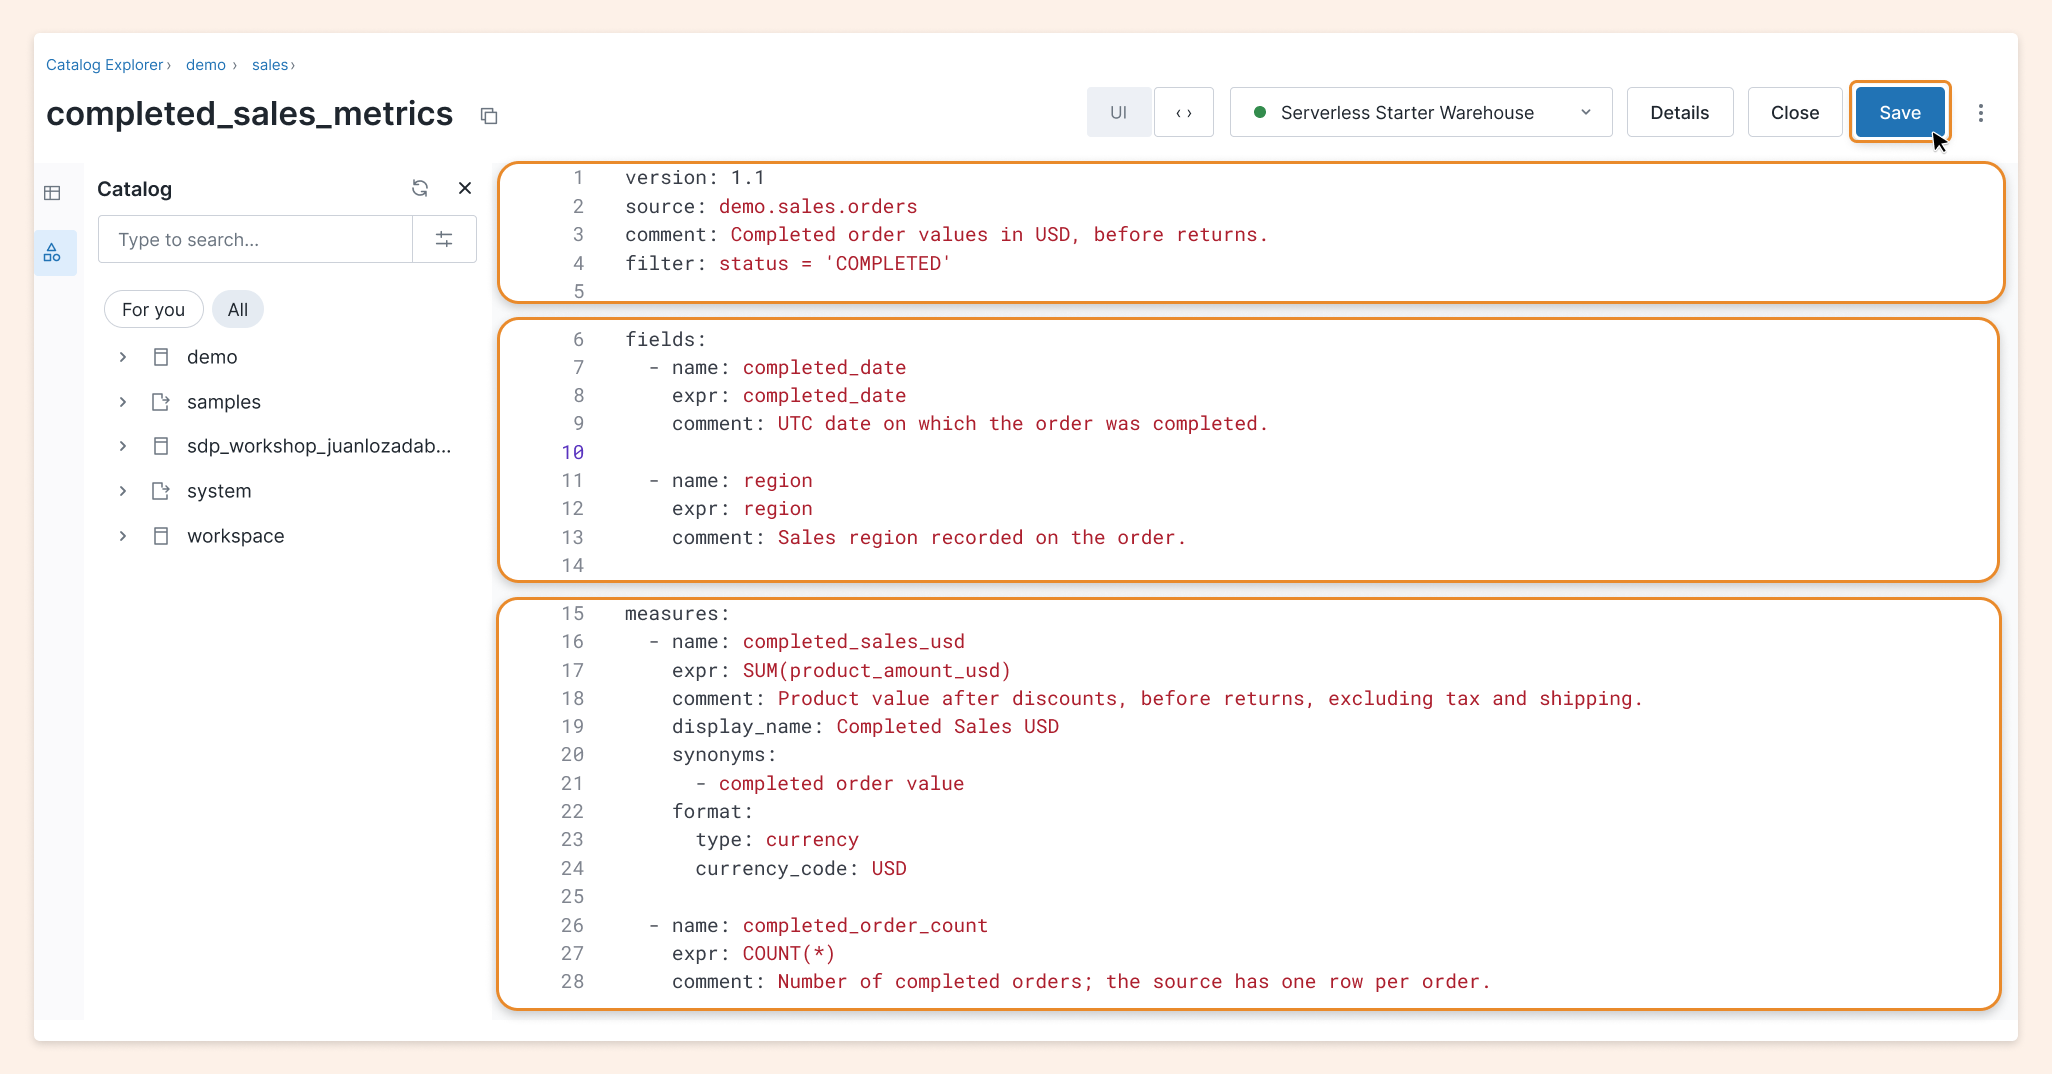
We save the metric view. The agent metadata used here requires YAML 1.1 and Databricks Runtime 17.3 or later when using Runtime. The low-code editor may use dimensions instead of fields; both names are accepted.
The COMPLETED filter is part of the shared definition. The reporting period belongs to the question. The USD format controls presentation; the source amounts must already be in USD.
To check the result, we run this query using a SQL warehouse:
SELECT
  region,
  MEASURE(completed_sales_usd) AS completed_sales_usd
FROM demo.sales.completed_sales_metrics
WHERE completed_date >= DATE '2026-08-01'
  AND completed_date < DATE '2026-09-01'
GROUP BY region
ORDER BY completed_sales_usd DESC, region;
The query returns all regions, so we can identify ties. We compare the totals with a reviewed calculation on the source data, then use them as a reference for Genie.
Governed tags: classifying assets with shared rules
Governed tags classify assets using controlled keys and values, with permissions that control who can assign them. In this walkthrough, they support organizing assets into Domains. Certification uses a system tag whose key and values Databricks defines.
Domains and subdomains: organizing assets by business purpose
Domains group assets by business area using governed tags. The business organization can differ from the catalog and schema structure, and an asset can belong to several domains or subdomains.
With the metric view ready, we open Discover.
We select Create domain.
We complete the form as follows:
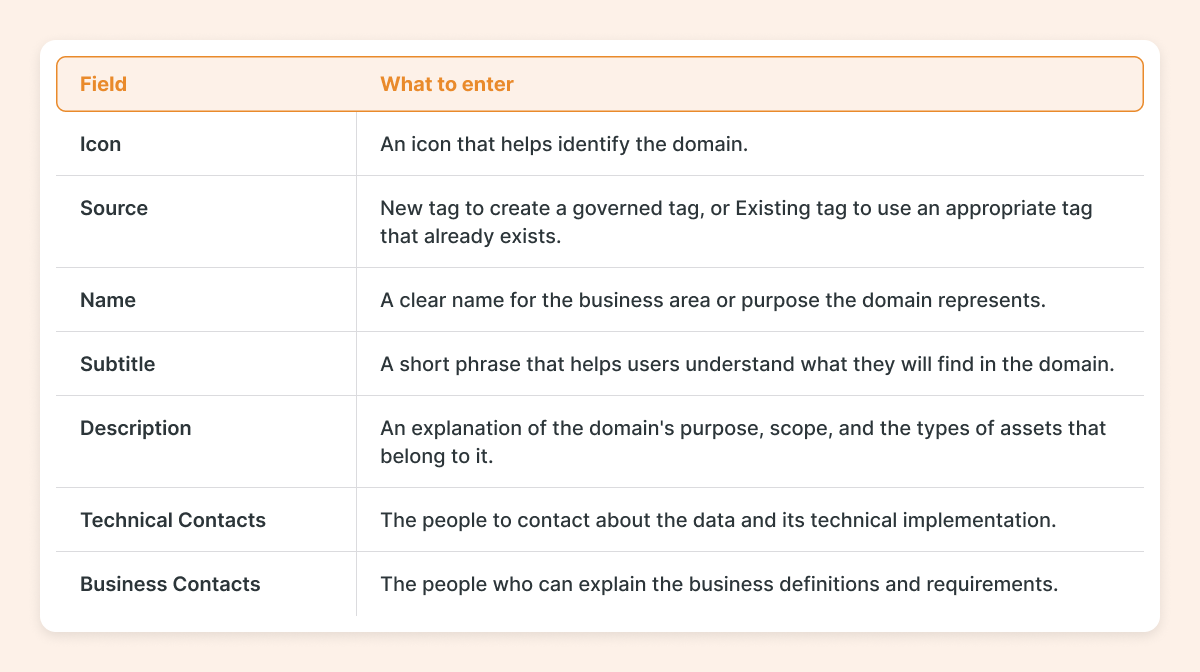
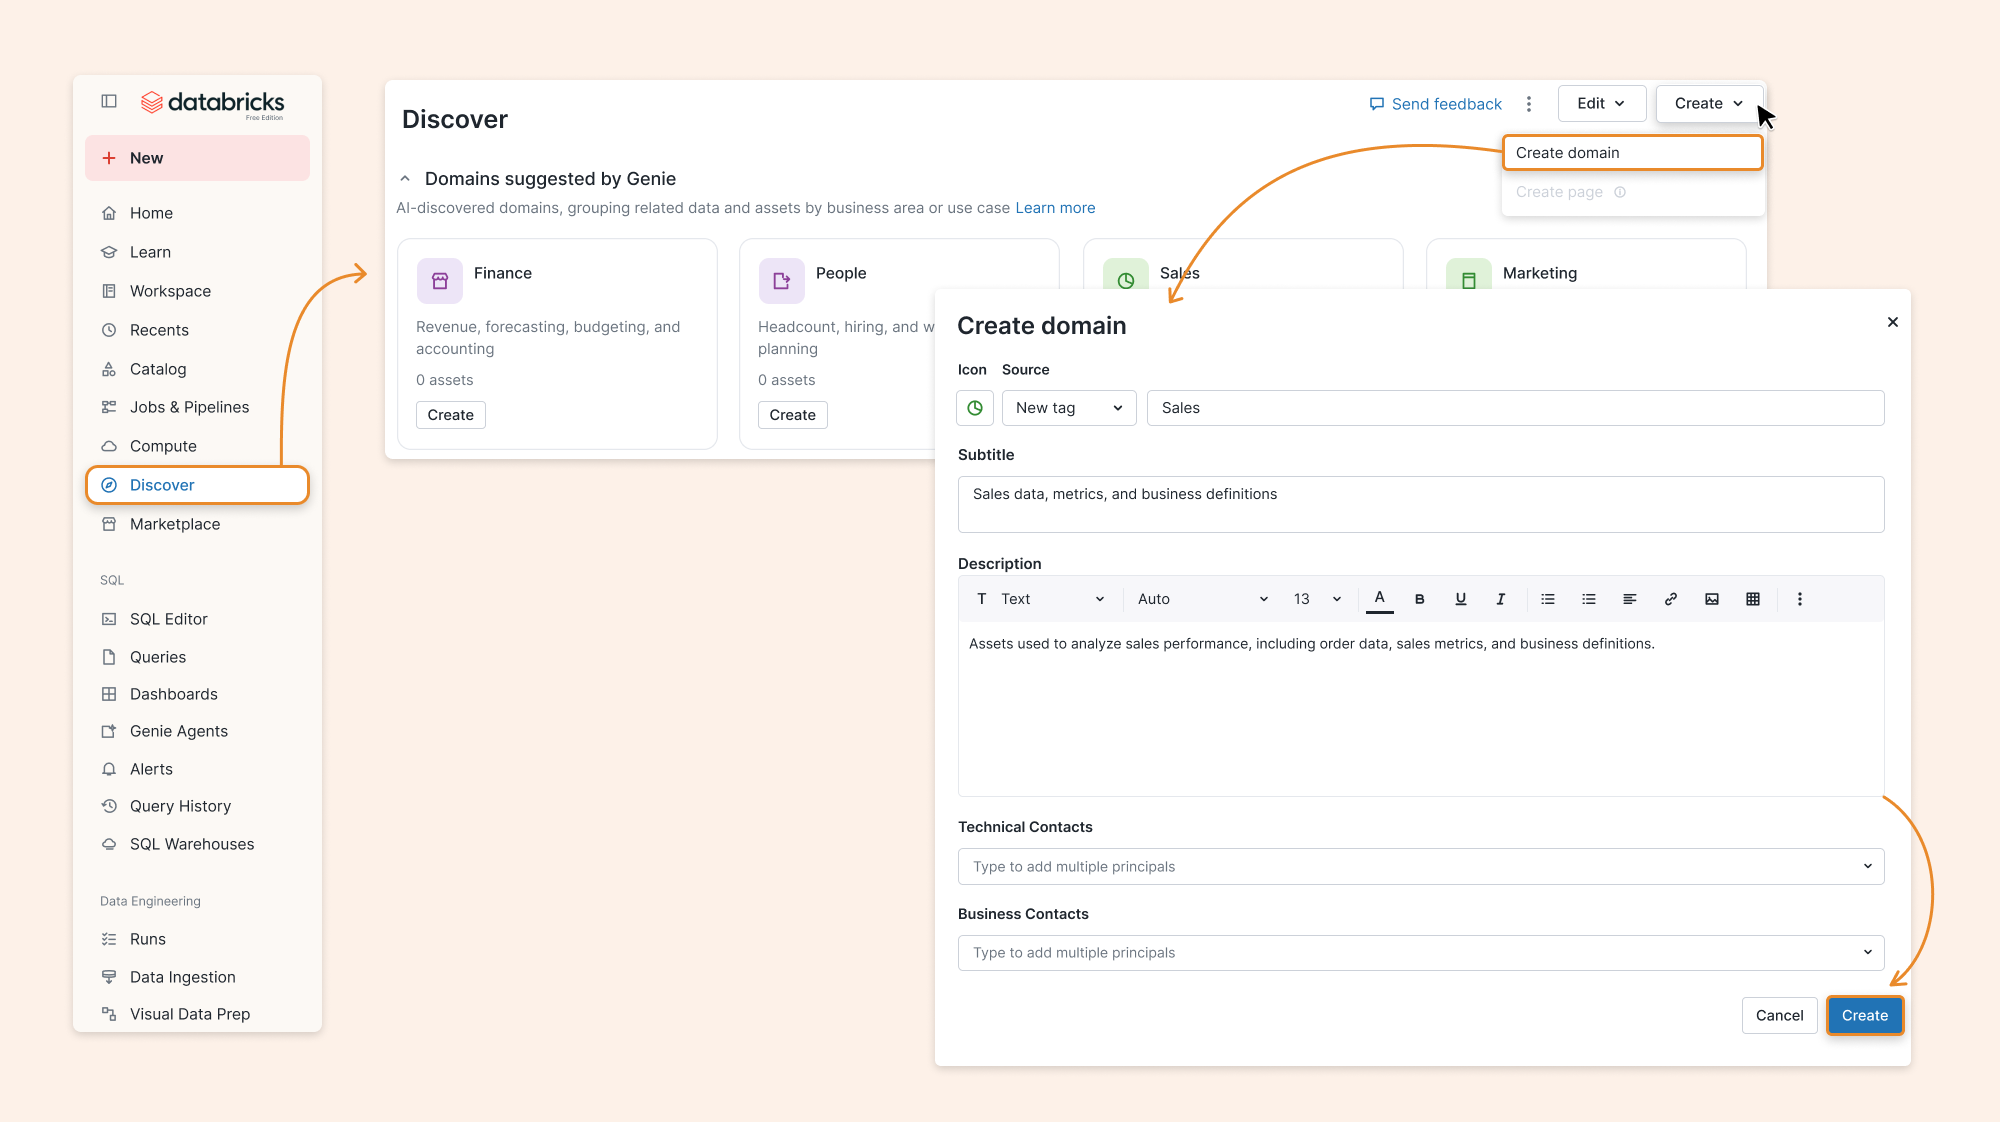
We select Create. The domain starts as a draft. Creating a domain requires MANAGE DISCOVER at the account level. Users with MANAGE on an existing domain can maintain that domain and its Pages. Databricks calls users with these management permissions curators.
We use Add to Domain to assign our completed sales metric view. This requires permission to apply the associated governed tag.
Next, we open Edit Sections → + Section to create a collection:
Title: a clear name for the collection.
Subtitle: a short explanation of what users will find in it.
Manually selected: the assets we want to display in the collection.
Alternatively, a Search query fills the section with matching assets. Here, we select the metric view manually to keep the example focused.
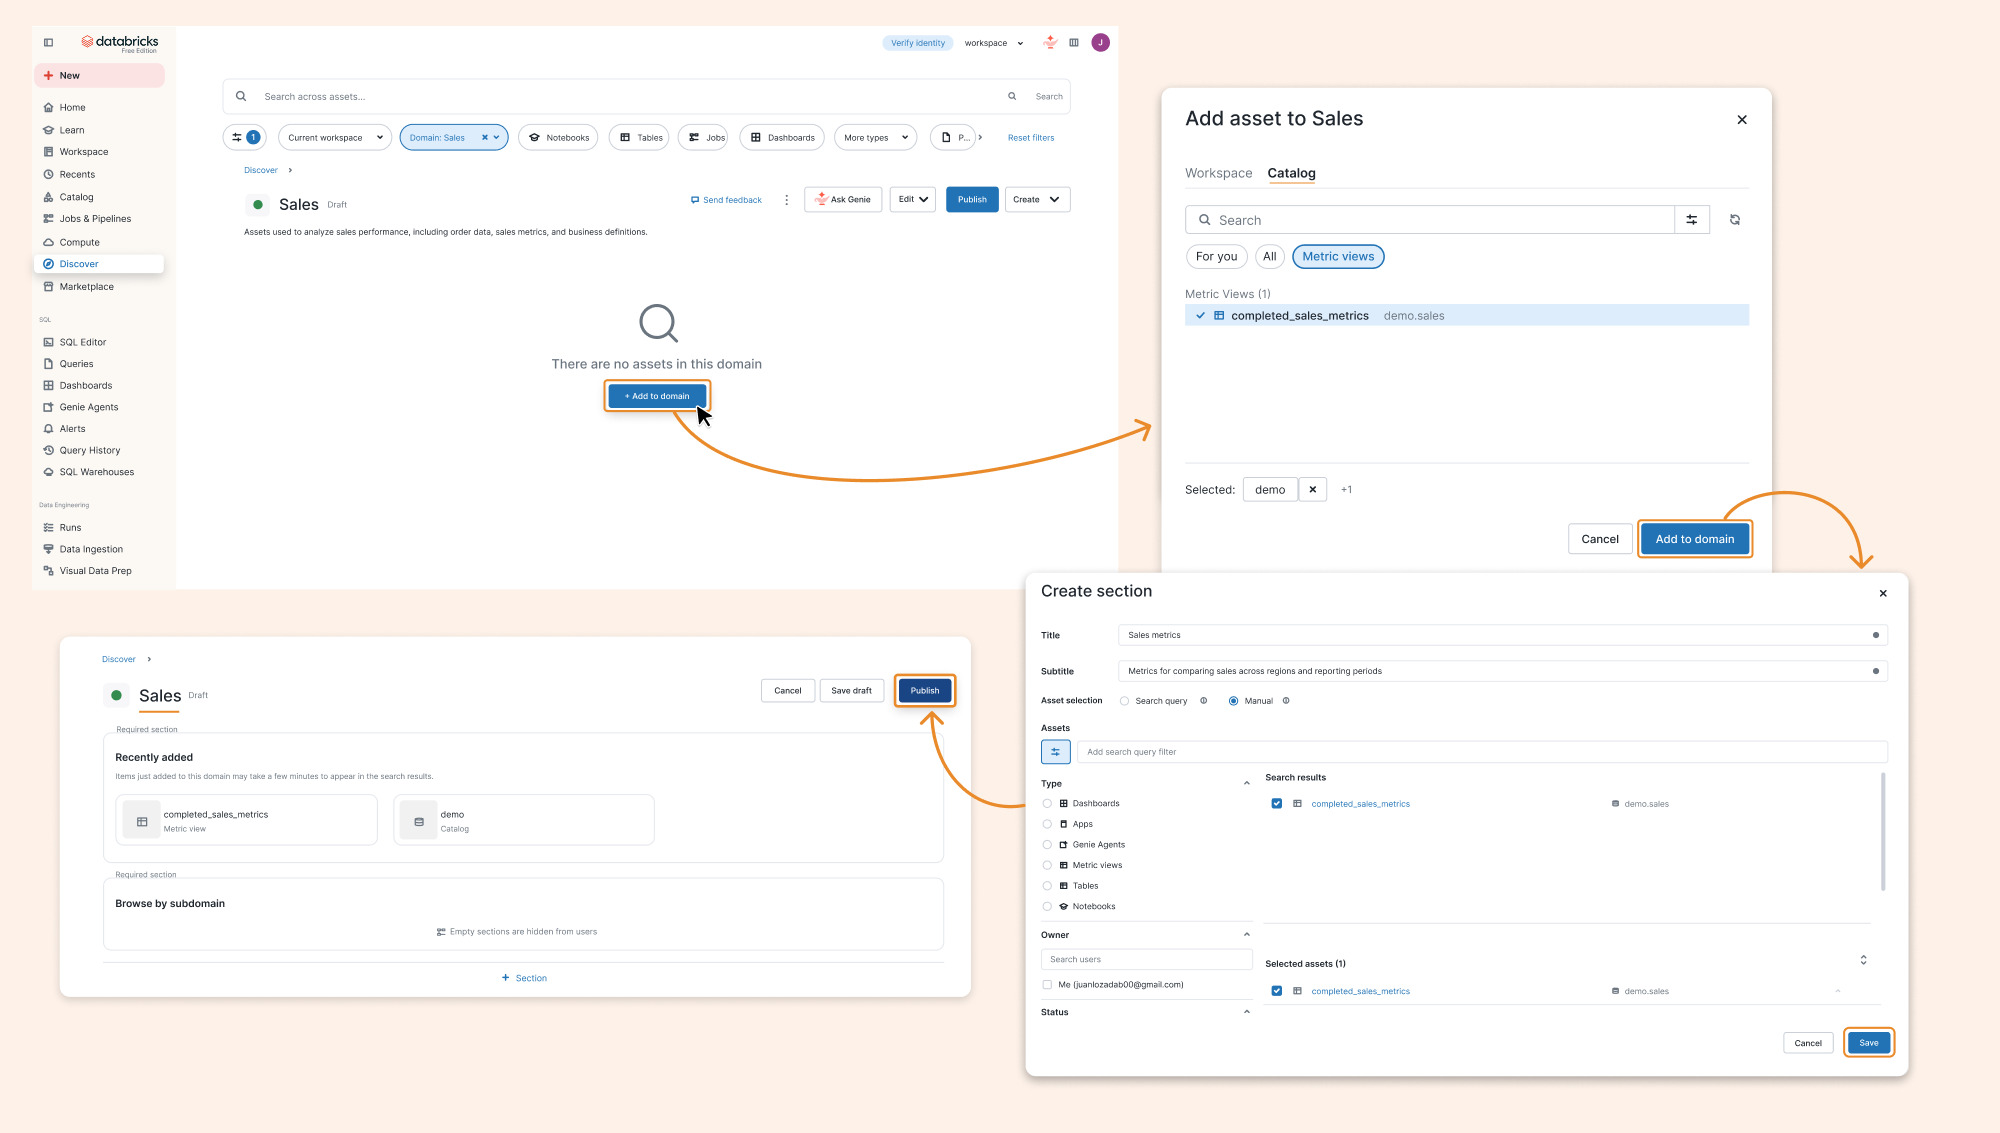
We save the section and select Publish to publish the domain layout. Assigning an asset to the domain and choosing how to display it are separate steps.
If Sales becomes too broad, we can add subdomains. One level of nesting is supported. For this example, a single Sales domain is enough. Domains also organize Pages, with each Page belonging to one domain or subdomain.
Pages: making business knowledge explicit
In our simplified sales example, we use a Page to document what completed sales means and when to use that definition.
From Discover → Pages, we select Create page and complete the following fields:
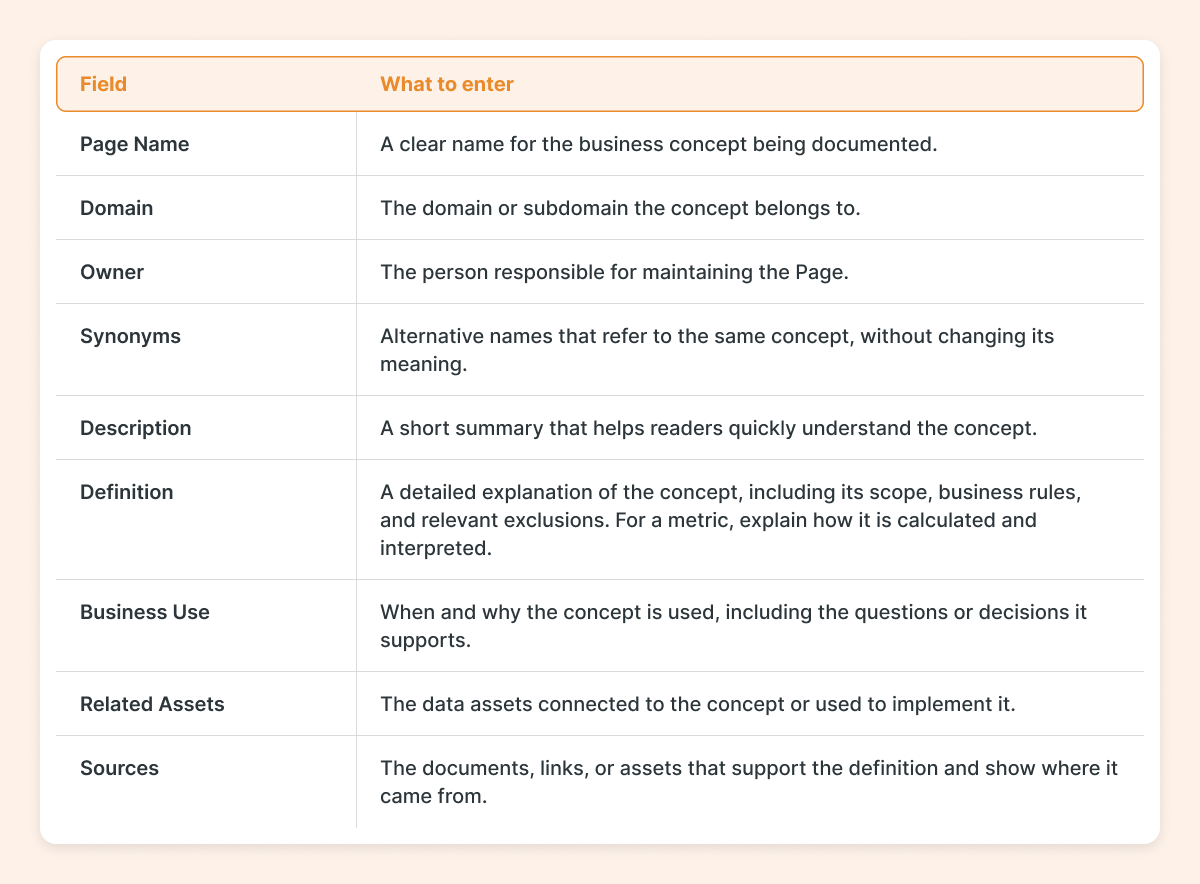
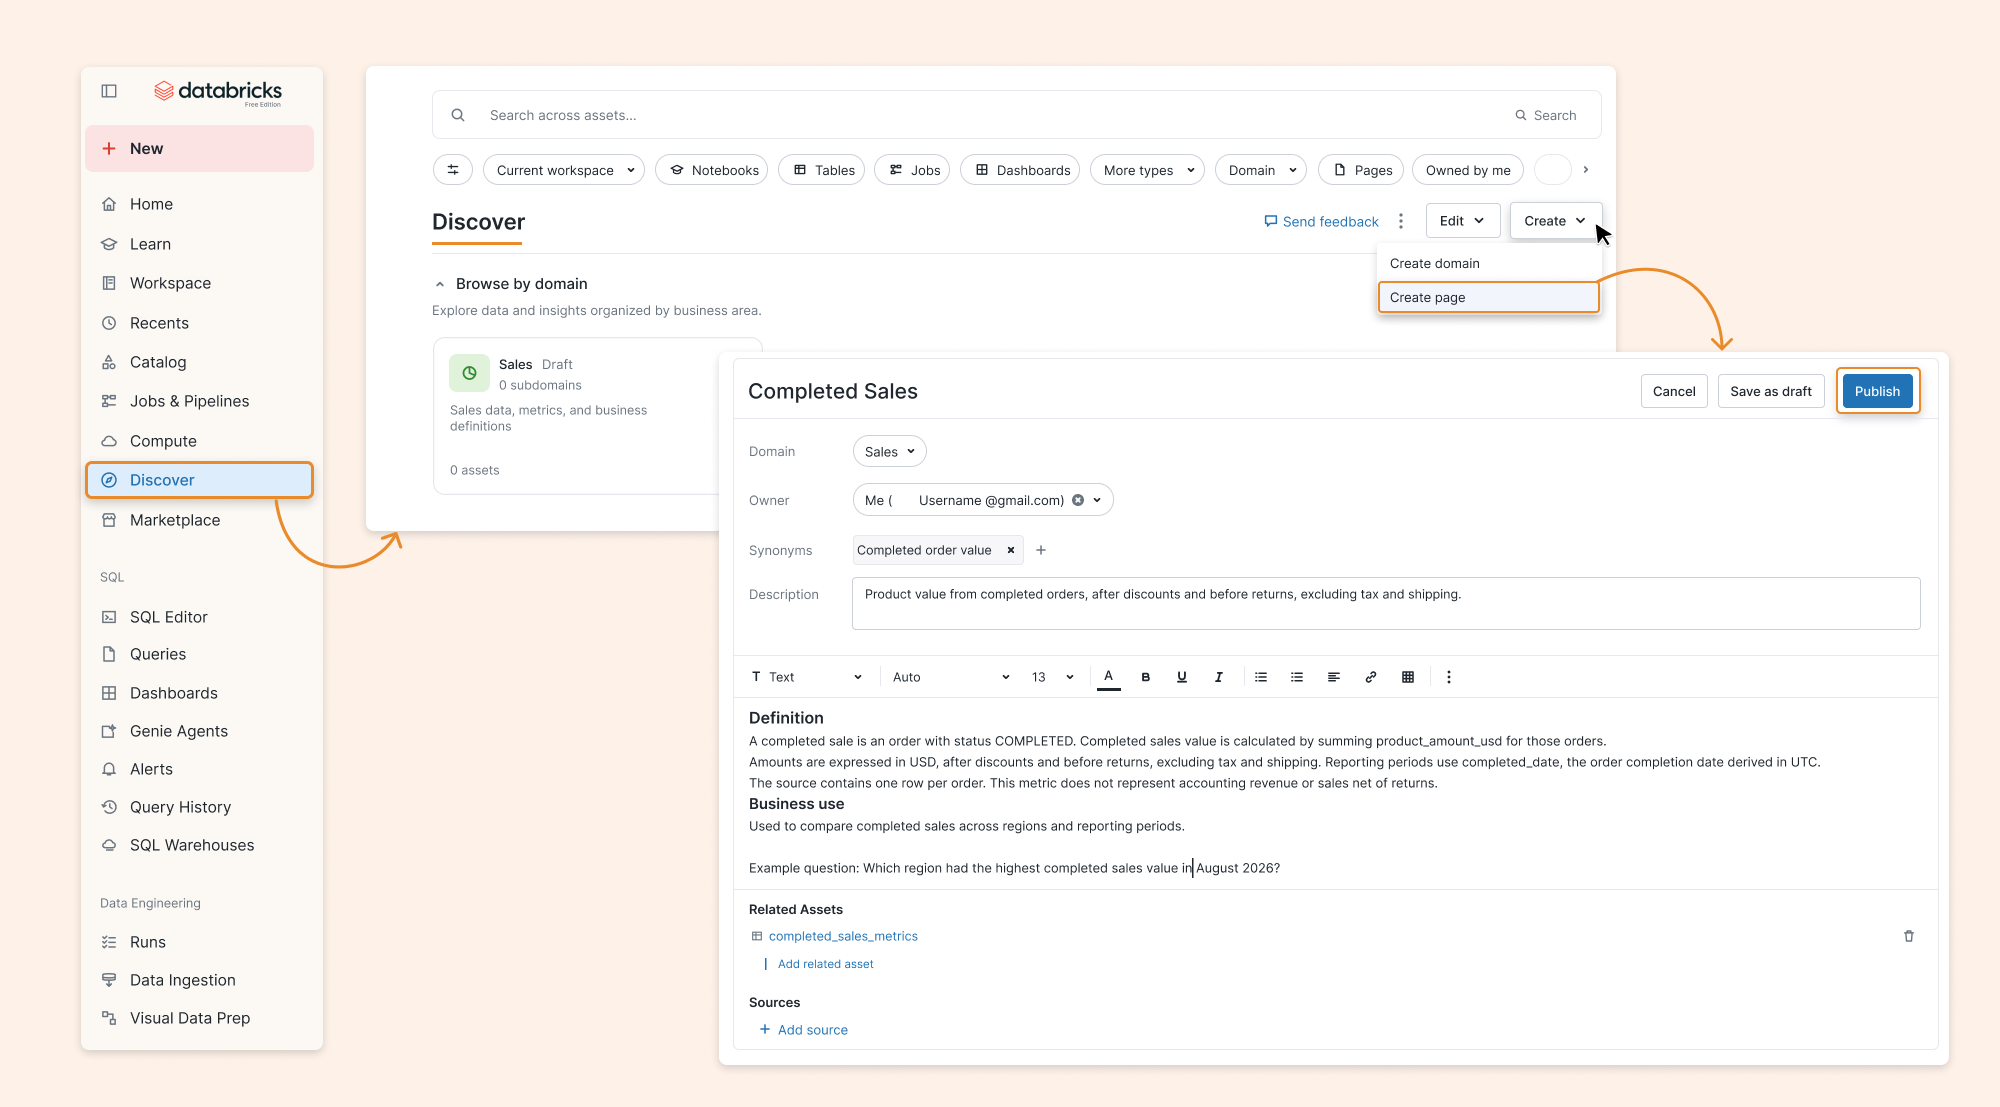
Related Assets connects the explanation to its implementation. Sources show where the definition comes from. After reviewing the content, we select Publish or Save as draft to continue later.
For this metric, the Page explains the meaning, and the metric view defines the calculation. If the business rule changes, we need to review both.
Suppose an older, widely used dashboard includes tax in its definition of “sales.” Its logic may become part of the inferred context. Our Page explains that completed sales excludes tax, making the difference explicit. Genie One prioritizes Page definitions over relevant inferred context, while the metric view’s certification provides another authority signal.
We still need to check the answer. If Genie uses a different definition, its citations and generated query help us investigate what happened.
Certification: showing authority and current status
Unity Catalog provides Certified and Deprecated statuses through the system tag system.certification_status. Certified indicates that an asset meets the organization's standards. Deprecated signals that it should no longer be used for new work.
After reviewing the definition, data, and results with the responsible owner, we open the metric view's menu and select Assign certification → Certified → Save. This requires permission to assign the certification tag and the appropriate asset permissions.
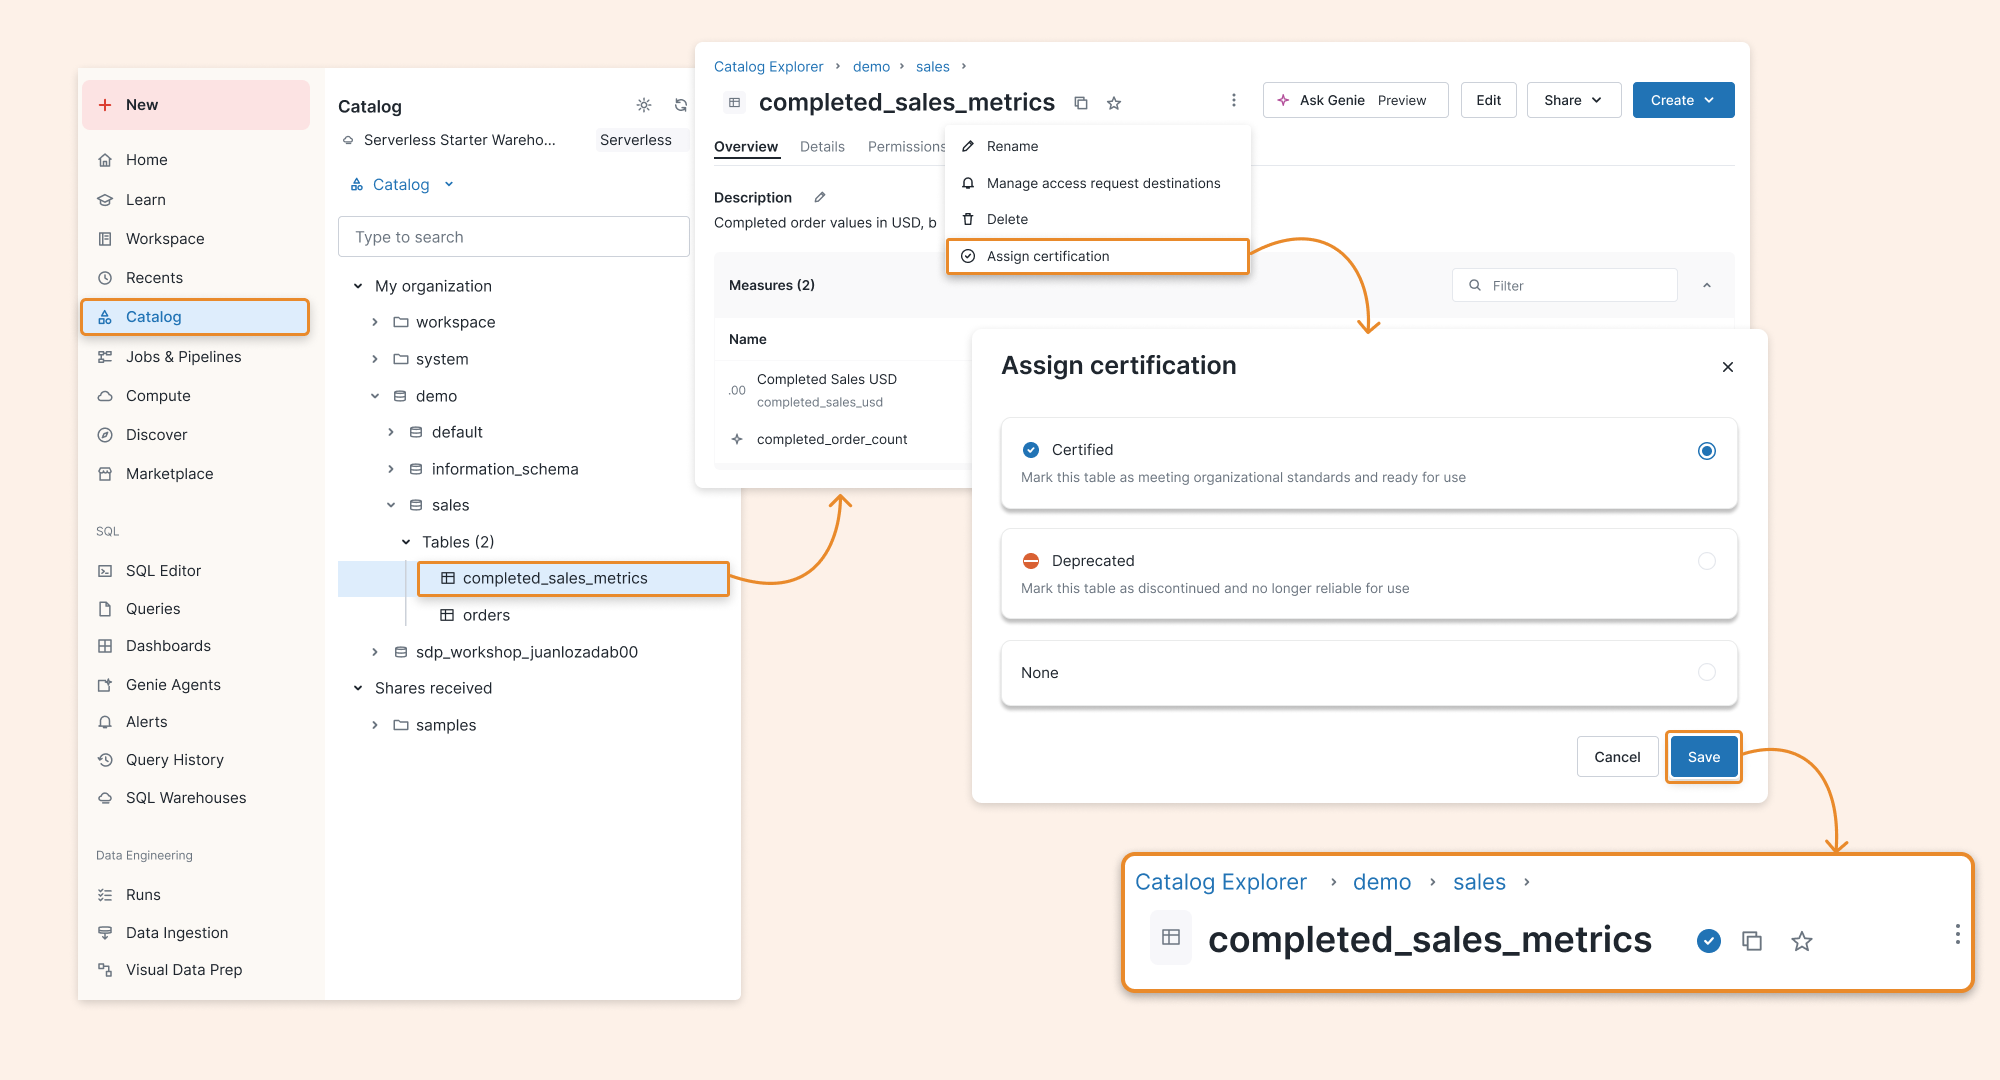
Assigning certification does not run quality checks. In this example, we certify the metric view and publish the Page.
You can still use a certified source incorrectly. A wrong filter or a misunderstanding of the question can produce an unsuitable answer, so certification does not replace evaluation.
Check the answers against the definition
For this example, we compare the metric view's results with a reviewed calculation over the source data. Then we test how Genie answers the business question. The checks cover both the result and its meaning:
Does it include only completed orders and use the completion date for the requested period?
Does the amount exclude tax and shipping, and is it presented as sales net of returns?
Does the answer handle ties between regions?
Do its query and citations point to the intended calculation and definition?
The same checks can guide benchmark questions for a Genie Agent. Chat mode compares SQL or results against reference SQL. Agent mode uses an LLM judge. To assess whether an ambiguous question leads to appropriate clarification, we use manual checks or an Agent mode evaluation with judge guidance; matching SQL results alone doesn't capture that behavior.
Each benchmark question starts a new conversation. Follow-up questions and access for different users need separate tests. Agent benchmarks also don't validate the full Genie One experience, so we test that experience separately when it is part of the solution.
When an answer fails, we look for the cause before adding more instructions. The definition might be unclear, the available context might be incomplete, or the query might use the wrong filter. These are different problems.
Keep the definition and its implementation aligned
The Page gives us a place to name the person responsible for the explanation. Technical and business contacts in the Domain help readers find the right people. Those fields are useful only if we also agree on who reviews changes.
If completed sales start to include a different order status, for example, we need to review the calculation, the descriptions, the Page, and the expected answers. Certification should reflect that review rather than remain a label nobody revisits.
This walkthrough uses several components, but you don't need to introduce them all at once. The useful starting point is a business definition that matters, an agreed calculation, and someone responsible for keeping them aligned.
From available data to usable business context
What I found valuable in this work was putting business knowledge somewhere people and Genie could use it. Metric views helped with reusable calculations. Pages helped explain the meaning behind the logic.
The sales example is simplified, but the responsibility is the same as in a real project: make the definition clear, connect it to its implementation, and check whether the answers follow it.
TL;DR
This walkthrough builds explicit business context for a hypothetical completed-sales metric:
Agree on its meaning and validate the source data before configuring the tools.
Review table and column descriptions, then create and check the metric view.
Organize related assets in a Domain and explain the business definition in a Page.
Certify the metric view after review, then evaluate Genie's answers against the agreed rules.
Creating the assets is the beginning. The definition, calculation, and expected answers need to stay aligned as the business changes.