Deploy Your Databricks Dashboards to Production
Despite Databricks' powerful analytics capabilities, dashboards often end up in chaos: living in development environments, lacking version control, and requiring manual recreation for each deployment. This results in inconsistent data, security gaps, and a maintenance nightmare.
The good news is you can productize your Databricks dashboards with proper CI/CD practices. Below, I'll walk you through the complete process to make your dashboards are reliable, reproducible, and actually production-ready.
1. Version Control Your Dashboard with Git
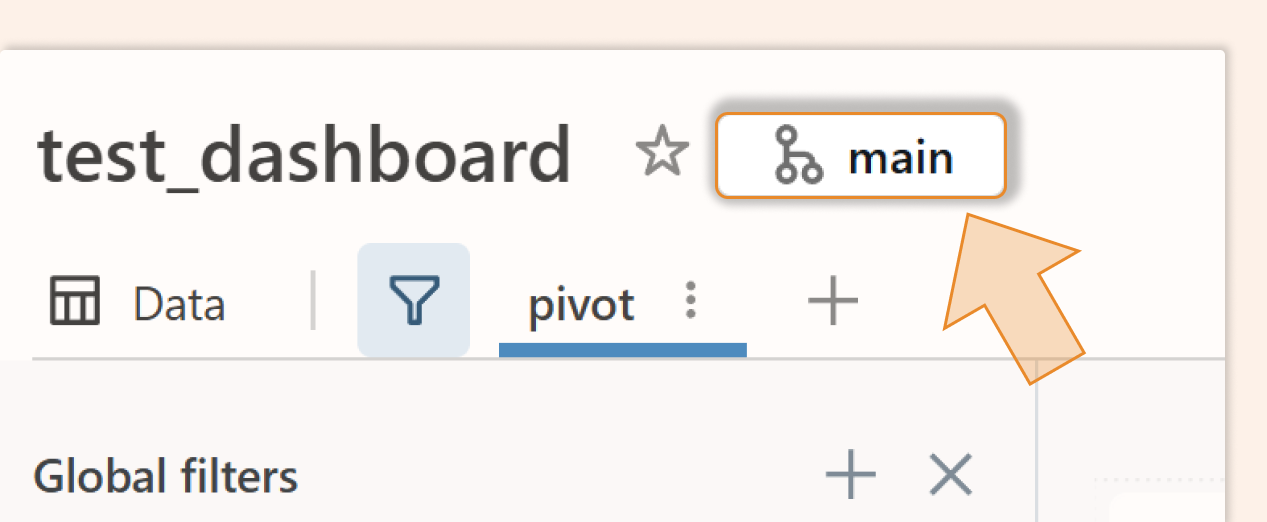
Use Git Integration: Use Databricks Git integration (Git folders) to track your dashboard lvdash JSON for version control. Place the dashboard in a Databricks Git-enabled folder. In the UI, you'll see a small Git icon if the dashboard is under source control. New dashboards can be created in a Git folder, or you can move an existing dashboard into one to start tracking it.
Edit the Draft, Not the Published Dashboard: All changes should be made to the draft (unpublished) version of the dashboard, which is synced with Git. Never edit the production published dashboard directly. Instead, commit changes and merge them via pull requests. This ensures the published dashboard in prod is always derived from the version-controlled JSON, preventing drift between environments.
2. Parameterize Your Datasets (Catalogs and Schemas)
Use dataset_catalog and dataset_schema: Databricks allows you to set a default catalog and schema for all queries in a dashboard via the
dataset_cataloganddataset_schemafields in the dashboard resource configuration. This means you can parameterize which data namespace (catalog/schema) the SQL queries use without changing each query.
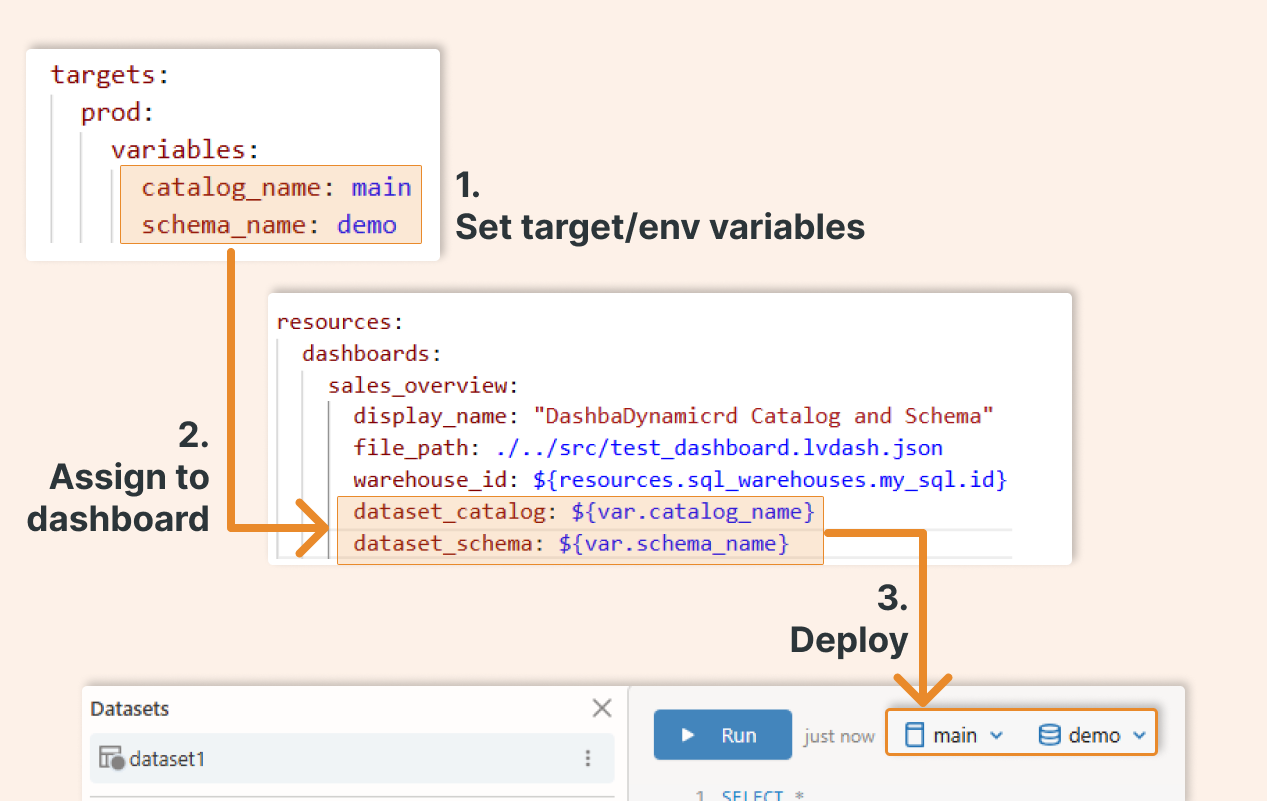
Environment-Specific Data: Use these fields to point the dashboard to different data in different environments. For example, in development, you might use a workspace.default schema, while in production you use main.demo. By configuring these as variables, you can deploy the same dashboard to various environments without editing the SQL.
Dedicated Schema for the Dashboard: If your dashboard needs to pull data from multiple schemas or has tables/views created specifically for it, consider creating a dedicated schema. This way, you can set
dataset_schemato that one schema and ensure all queries reference the intended tables. It simplifies maintenance and prevents mixing data from different schemas in a single dashboard. In that dedicated schema, you can use metrics views, which are optimized for dashboards.
Example: Imagine all your dashboard queries should read from the main.demo schema in prod. You can define a variable schema_name (with a default for dev and override for prod), and set dataset_schema: ${var.schema_name} in the dashboard config. At deploy time, this will ensure every unqualified table in the dashboard queries uses main.demo in prod (and e.g., workspace.default in dev).
3. Create a Databricks Asset Bundle for the Dashboard
Now that your dashboard is version-controlled and parameterized, it's time to make deployment repeatable. Databricks Asset Bundles (DAB) let you define your entire dashboard infrastructure as code, including the dashboard itself, SQL warehouses, refresh jobs, and dependencies.
Think of DAB as your deployment blueprint: write it once, deploy it anywhere (dev, staging, prod) with environment-specific configurations.
Define Variables: In the bundle YAML, define variables for items that change across environments (such as catalog or schema names or warehouse sizes). For example, you might have
catalog_nameandschema_namevariables with defaults for development, and override them for production. This makes your bundle portable.Dashboard Resource Configuration: In the YAML, add a dashboards section to specify your dashboard. Include fields such as
file_path(the path to your exported dashboard .lvdash.json file in your repo),display_name(user-friendly title),warehouse_id(the SQL Warehouse to run queries), and thedataset_catalog/dataset_schemapointing to your variables. You can also setembed_credentialshere (more on that shortly).SQL Warehouse Resource: If your dashboard needs a new SQL Warehouse (for example, a dedicated SQL endpoint or a serverless warehouse), you can define a
sql_warehousesresource in the bundle. This can create a warehouse with a specified size, auto-stop, etc., and you can reference its ID in the dashboard config. Alternatively, you can reference an existing warehouse by ID or name by using the lookup function.Example Bundle YAML: Below is an example bundle.yaml snippet for deploying a dashboard using a bundle:
bundle:
name: "dashboard-deployment"
variables:
catalog_name:
default: workspace # default catalog (dev environment)
schema_name:
default: default # default schema (dev environment)
targets:
prod:
mode: production
default: true
workspace:
host: https://<your-databricks-workspace> # Prod workspace URL
root_path: /deployment/.bundle/dashboard_test/ # Path in workspace to deploy
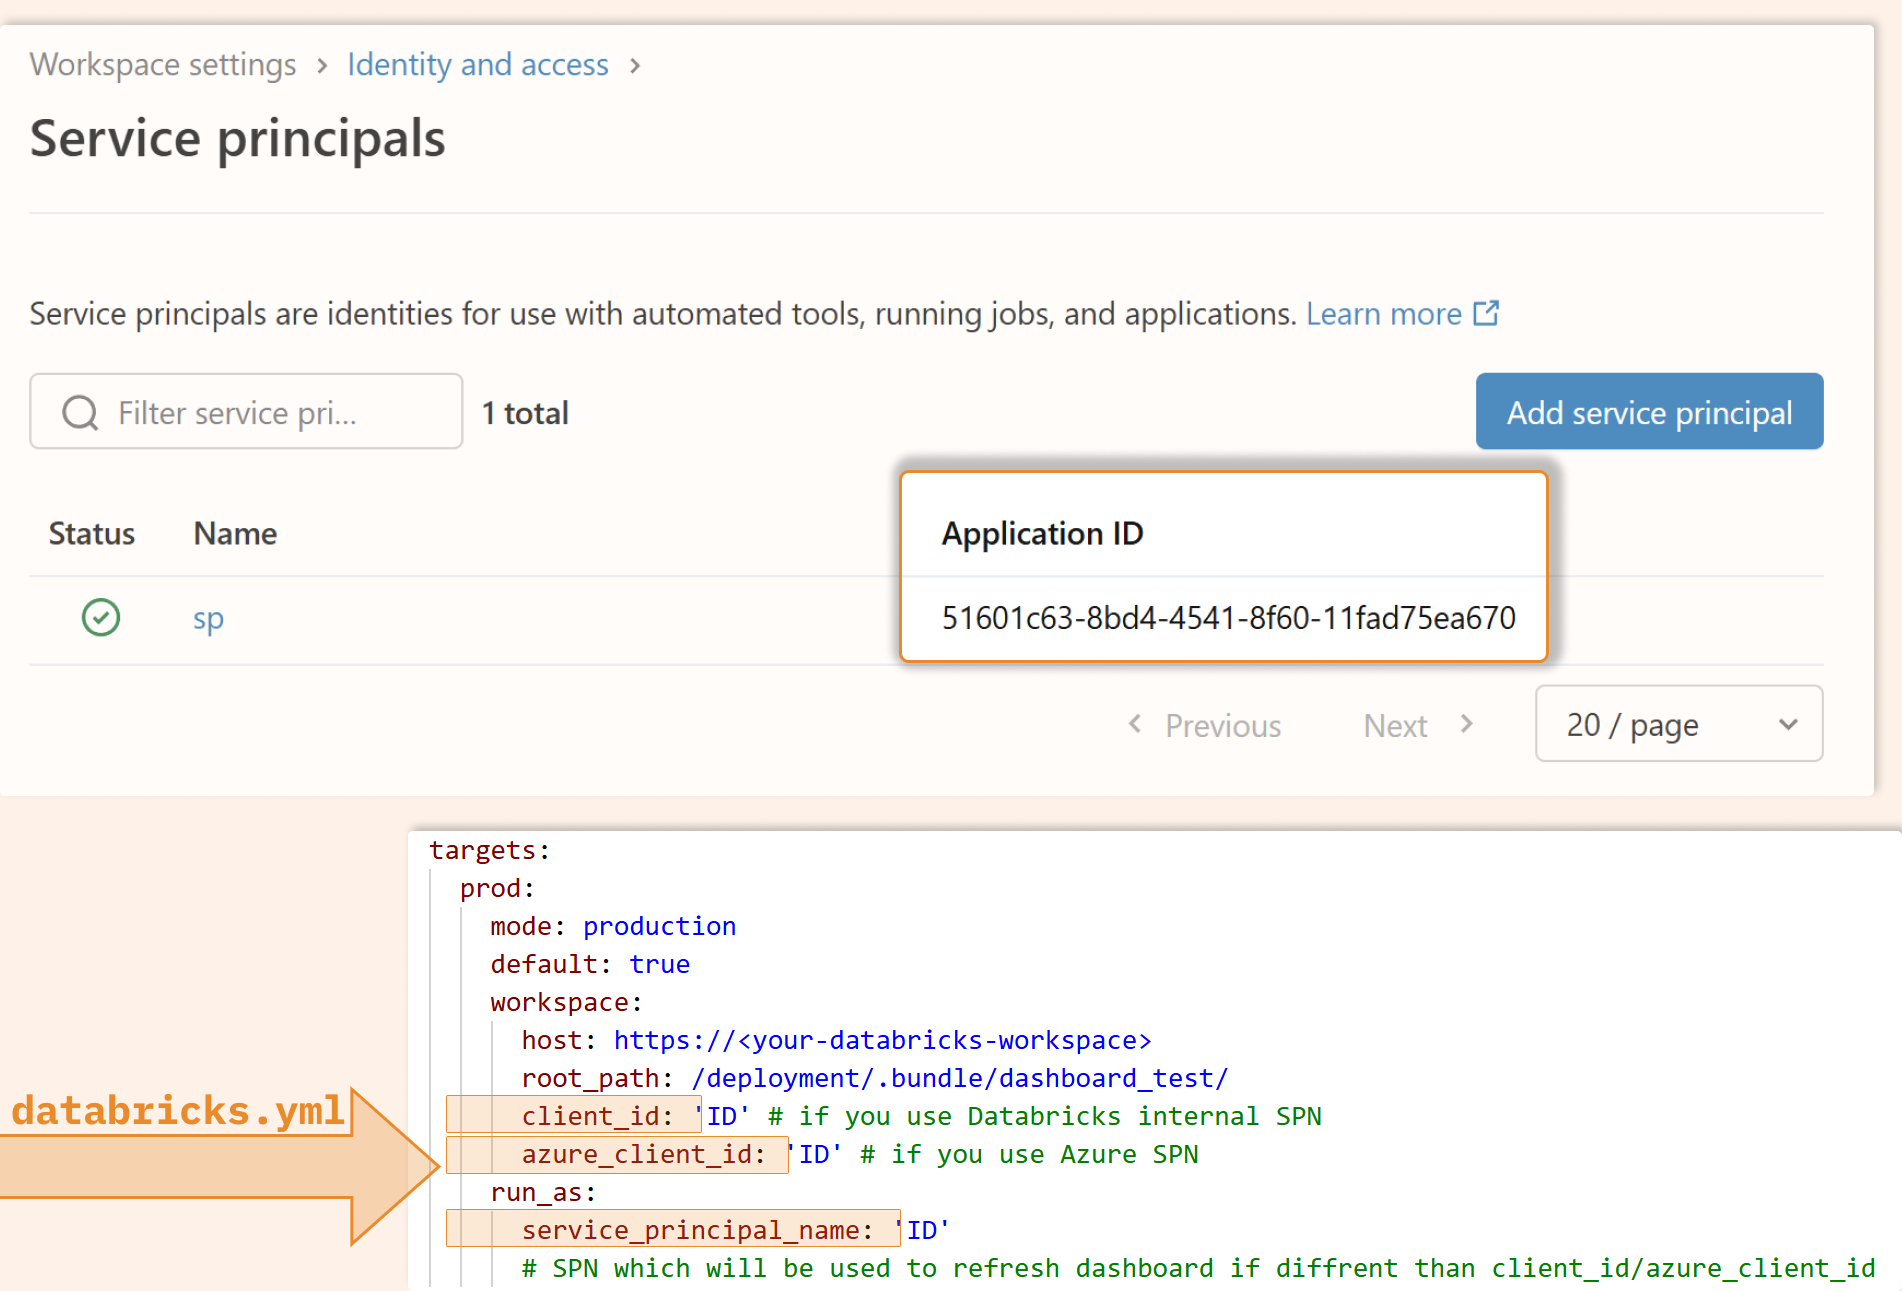
client_id: 'ID' # if you use Databricks internal SPN
azure_client_id: 'ID' # if you use Azure SPN
variables:
catalog_name: main # use main catalog in prod
schema_name: demo # use demo schema in prod
run_as:
service_principal_name: 'ID'
# SPN which will be used to refresh dashboard if diffrent than client_id/azure_client_id
resources:
dashboards:
sales_overview:
display_name: "Sales Overview Dashboard"
file_path: ../src/test_dashboard.lvdash.json # path to your dashboard which you store on git together with that databricks.yml bundle
warehouse_id: ${resources.sql_warehouses.my_sql.id}
dataset_catalog: ${var.catalog_name}
dataset_schema: ${var.schema_name}
embed_credentials: false # Do NOT share credentials; use viewer's credentials
sql_warehouses:
my_sql:
name: "my_sql_warehouse"
cluster_size: 2X-Small
max_num_clusters: 1
auto_stop_mins: 10
enable_serverless_compute: true
In the above config, we parameterize the dashboard’s data sources. For instance, in the prod target, we set catalog_name = main and schema_name = demo, so the dashboard will look at the main.demo schema in production. The dashboard JSON file (test_dashboard.lvdash.json) is the dashboard that you stored in the git folder. We also create a tiny serverless SQL warehouse (my_sql_warehouse) and reference it. The embed_credentials: false setting ensures the dashboard will run AS each viewer (not with a shared service account), which is usually safer for data governance (but is not the default setting).
4. Deploy the Dashboard Bundle to Production
Use the Databricks CLI: Once your bundle config is ready and your dashboard JSON is in place, you can deploy it using the Databricks CLI (v2). Authenticate with a Service Principal (recommended for CI/CD) or an appropriate user account. For example, run: “databricks bundle deploy --environment prod” to deploy to the prod target defined in your YAML.
Deploy to Multiple Environments: You can have multiple targets (e.g., dev, staging, prod) in the bundle YAML. Each target can point to a different workspace or different variables. This allows you to promote the same dashboard through environments by simply changing the target in the deploy command.
Post-Deploy (Publishing): The deploy command publishes the dashboard to the target workspace (under the specified
root_path).Service Principal for Automation: Using a dedicated service principal for deployment is a best practice. For example, on Azure Databricks, you might use an Azure AD app registration as the SP. There is also a possibility of creating a service principal inside Databricks. However, if all your users and SP are managed by Active Directory, creating the SPN directly in Azure is the best option. This principal should have permission to write objects (dashboards, etc.) in the workspace. It will act as the "publisher" of the dashboard in the target environment.
Avoid Manual Changes in Prod: If you deploy the bundle and later someone makes manual edits to the dashboard in production, the JSON in Git will diverge from the workspace version. This can cause deployment errors (for example, DAB will detect a diff and may refuse to overwrite without --force). To avoid this, treat the deployed dashboard as read-only — make further edits in development, then redeploy.
5. Schedule Dashboard Refreshes in Production
Keep Data Fresh: After deploying, set up a mechanism to refresh the dashboard so it shows up-to-date results. Dashboards in Databricks don't update automatically unless triggered by a schedule, job, or user.
You can set it via the UI, but you should store it as code and use a Databricks Job under DABS to refresh it.
In the Jobs UI (or in your bundle YAML under resources.jobs), configure a task of type "Dashboard" and select the target dashboard to refresh. You can specify a SQL warehouse for the task (or it will use the dashboard's default warehouse). This approach lets you:
Chain the dashboard refresh to run after data pipelines or other tasks. For example, you might schedule an ETL job to update tables, then have a dashboard refresh task run after it completes. This ensures the dashboard refreshes only when new data becomes available.
You could even tie the job to a table trigger so that an update to the data can trigger a dashboard refresh.
If the dashboard was published with shared data (i.e., using a service principal’s credentials for all viewers by setting
embed_credentials = true), then the job will refresh the dashboard using the deployment account’s credentials. All viewers will see the refreshed data (even if they personally lack permission), because the data access is tied to the publisher’s rights. This can improve performance (via the shared result cache), but may bypass some security controls.If the dashboard was published with individual data permissions (
embed_credentials = false, which is recommended for production security), the job’s refresh will populate the cache, but viewers will only see results for data they have access to. In fact, with the individual mode, each viewer may have their own cache or might need to trigger a refresh if they have never run the dashboard. The upside is that it respects Unity Catalog permissions for each user.
6. Leverage Metric Views for Performance
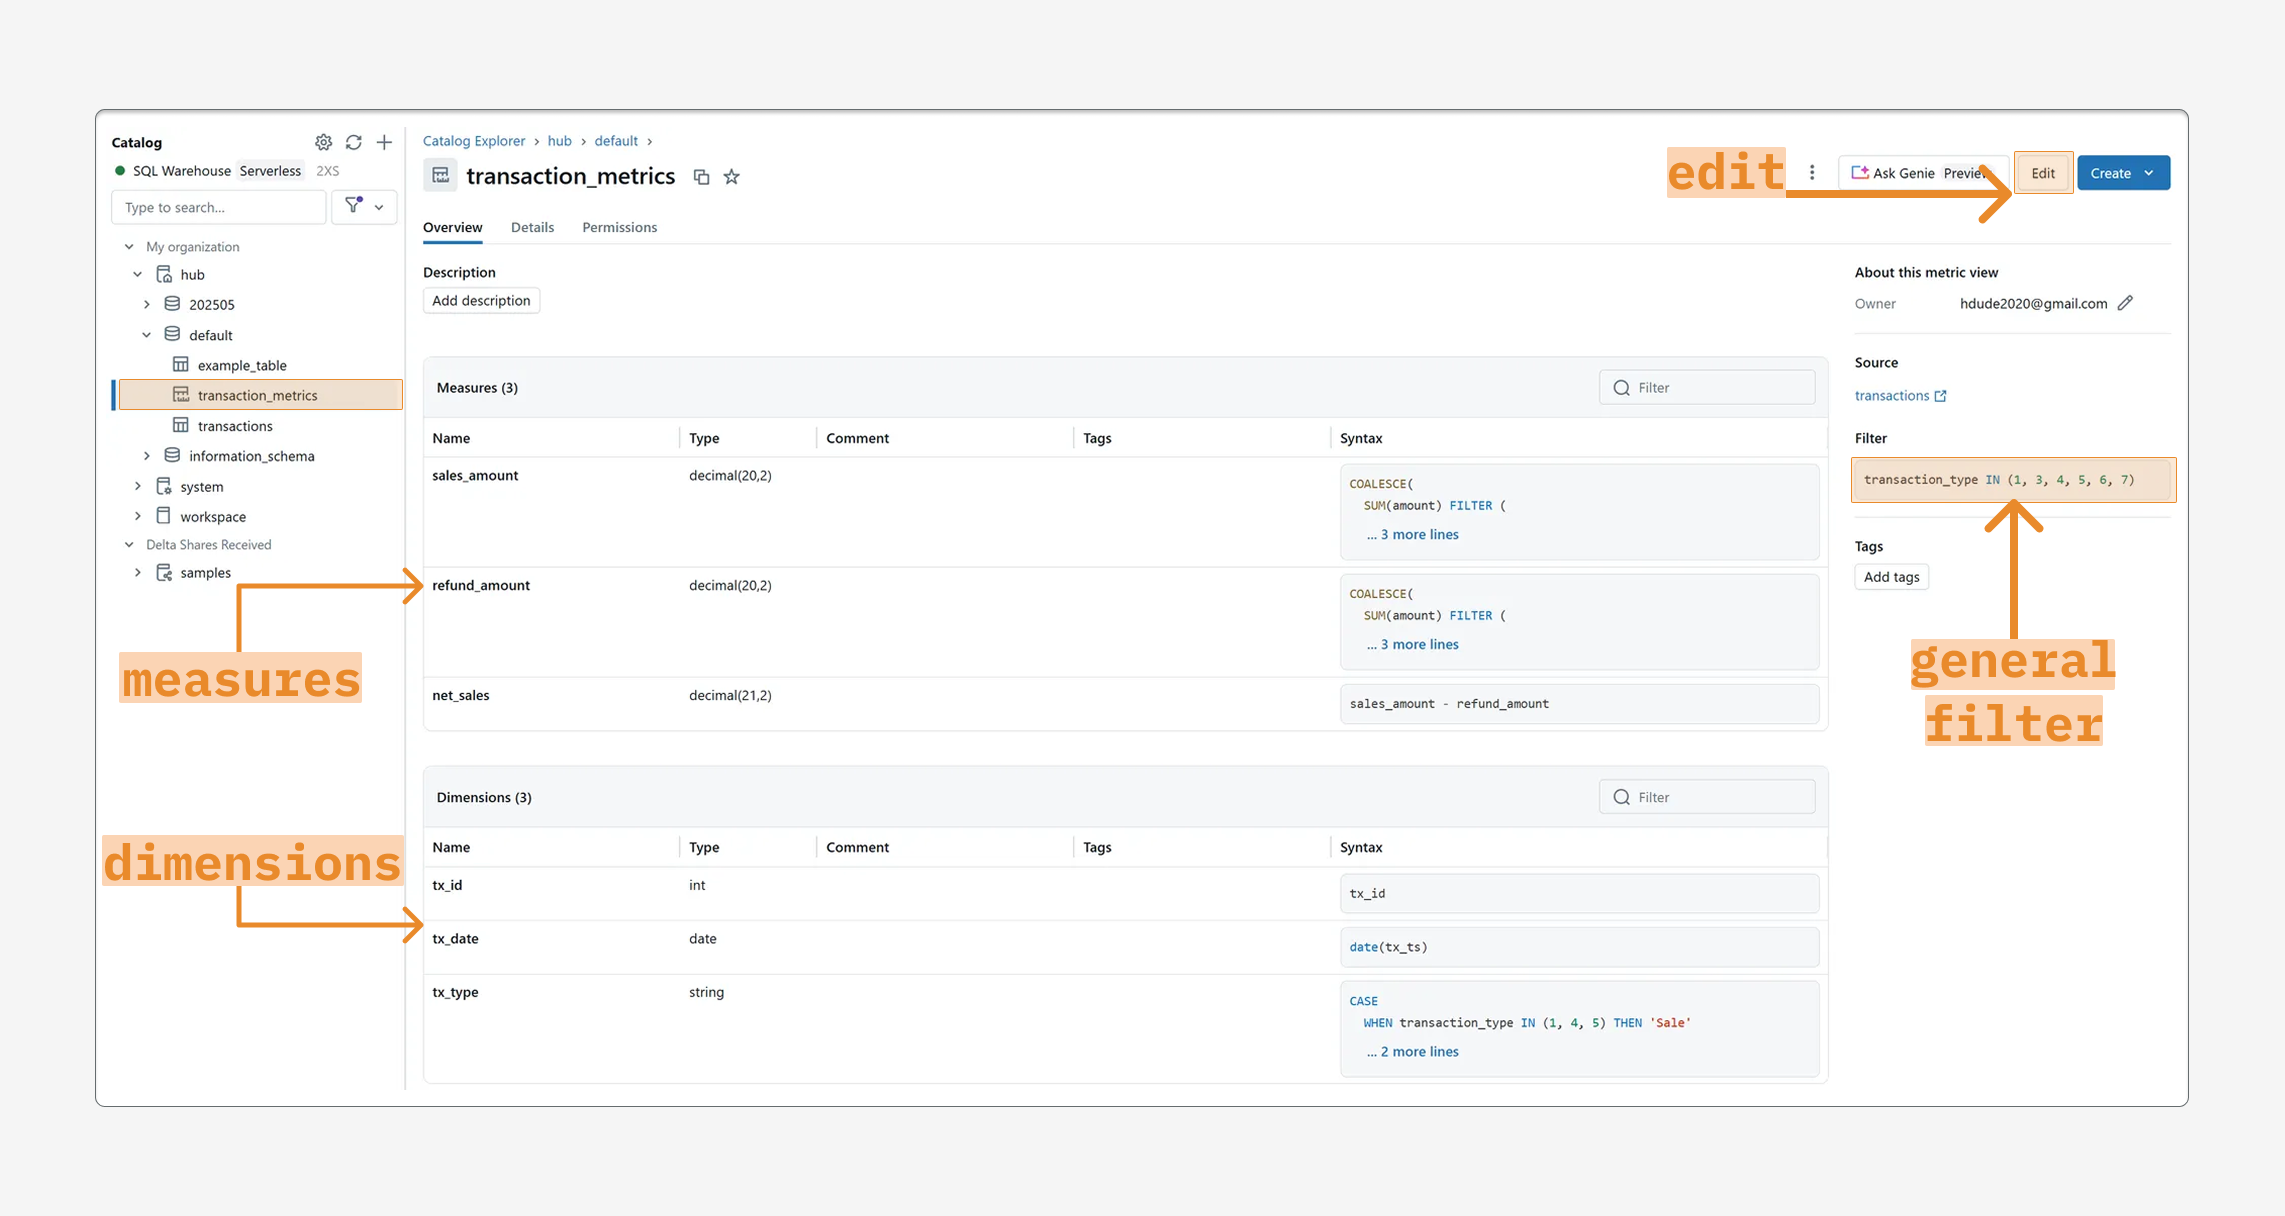
Use Unity Catalog Metric Views: Databricks Metric Views provide a centralized way to define key business metrics (with dimensions and measures) in Unity Catalog. They ensure consistent calculations across reports. If your dashboard involves complex aggregations or metrics used elsewhere, consider defining them as metric views.
Enable Materialization: Databricks now supports materialized metric views, which can drastically speed up dashboards. Materialization for metric views caches query results and keeps them updated on a schedule. The query optimizer automatically uses precomputed data when you query the metric view, accelerating dashboard load times.
Benefits: Using metric views with materialization gives you the benefits of pre-computation and incremental updates without manual pipeline work. Your dashboard queries (e.g., SELECT ... FROM my_metric_view) will fetch from a fast, cached layer when possible, and fall back to live data if needed. This leads to faster and more consistent dashboard performance for end users.
When to Use: If your dashboard is slow due to heavy calculations or if multiple dashboards use the same metrics, metric views can help improve performance. Define the metric logic once, materialize it on a schedule, and let all dashboards benefit from the cached results.
Best Practices and Conclusion
Don't Skip Proper Deployment: Even experienced data engineers sometimes create dashboards interactively and never promote them properly, leading to a mess of out-of-sync dashboards across different workspaces. Avoid this by developing your dashboard in a controlled environment, using Git for version control, and deploying it through an automated process. This brings discipline and consistency to dashboard management.
Use Databricks Asset Bundles (DAB): DAB provides a repeatable, infrastructure-as-code approach to deploying dashboards and other artifacts. It helps you capture not just the dashboard definition, but also its dependencies (warehouses, jobs, etc.) in code. This makes deployments reproducible and less error-prone. Your dashboards can be deployed to multiple environments with confidence that each environment uses the correct data sources and settings.
Leverage Metrics & Caching: If your dashboard is critical or heavy, invest time in optimizing it. Use metric views and materialized views to cache expensive computations. Scheduled refreshes (especially with shared result caches) can dramatically improve user experience by ensuring fast load times for everyone. Just be sure to balance performance with security (as discussed regarding credentials).
Security First: Always consider data access controls when deploying your dashboard. In most cases, do not embed credentials (leave
embed_credentials: false) so that each user only sees data they are allowed to see. This aligns with Unity Catalog’s fine-grained security. Only use a shared service account for dashboard queries if you have a specific need and have locked down the data that the dashboard presents.SQL warehouse: If you expect a higher load, like more than 10 users querying the dashboard at the same time, consider setting max_num_clusters to at least 2. You will normally pay for 1 cluster, but in a heavy load situation, it will deploy a second cluster to avoid queuing SQL queries.
In summary
Deploying Databricks dashboards to production involves: tracking the dashboard in Git, parameterizing environment-specific details, using Asset Bundles to deploy consistently, and setting up automated refresh schedules. Following these steps will ensure your dashboards are reliable, reproducible, and secure in a production environment. Your end users will thank you for a fast, up-to-date dashboard, and your future self will thank you for the maintainable deployment process!