SQL: Why Materialized Views Are Your Simplest Data Transformation Tool
Why overcomplicate your data pipelines? Databricks materialized views offer the perfect balance of simplicity and efficiency for most transformation needs.
"But will the materialized view be recomputed every time?" Only for certain complex SQL statements, and I'll show you how to avoid that trap.
How do I know if it's incremental? By the end of this article, you'll know exactly how to verify and optimize incrementality.
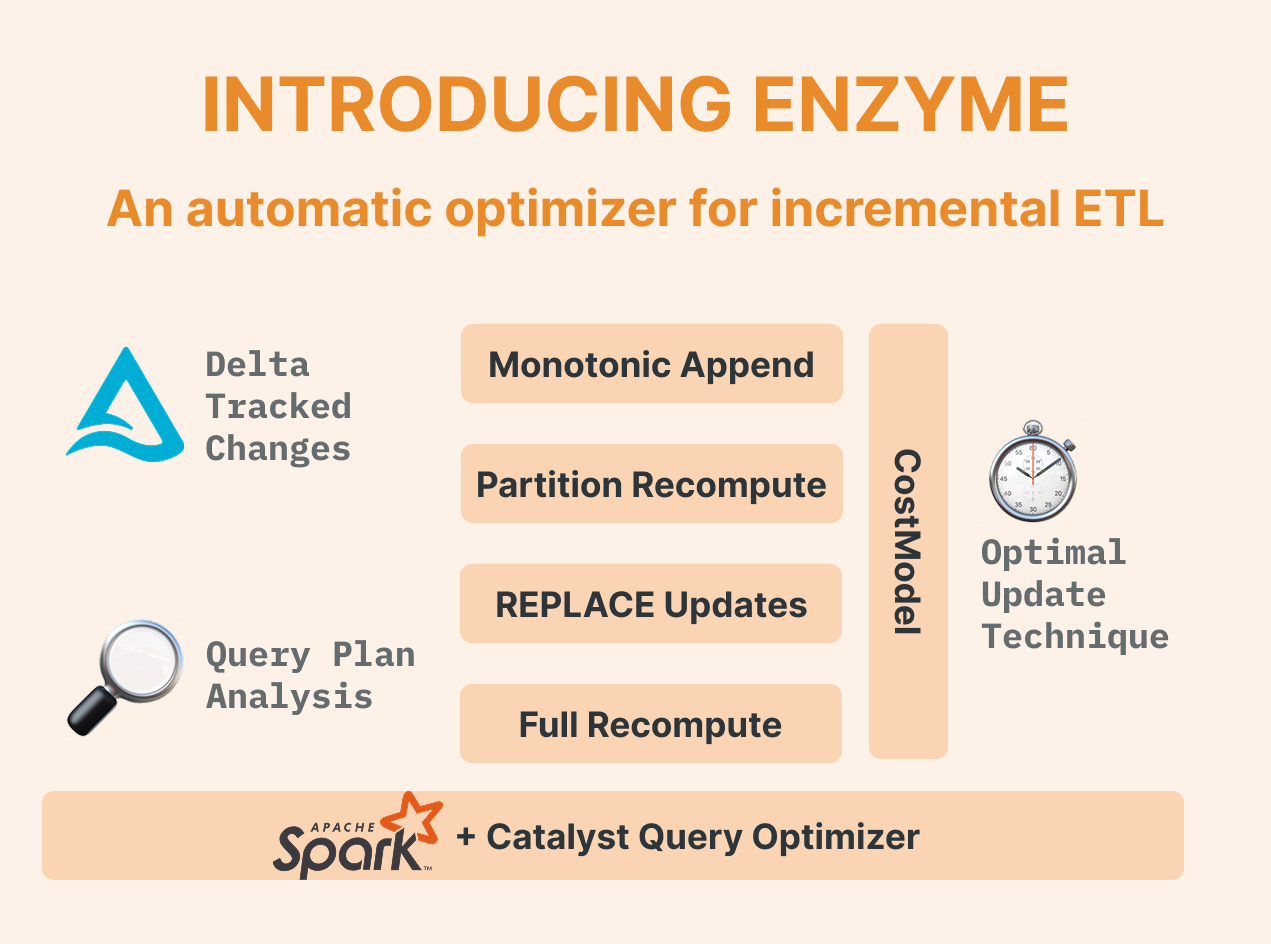
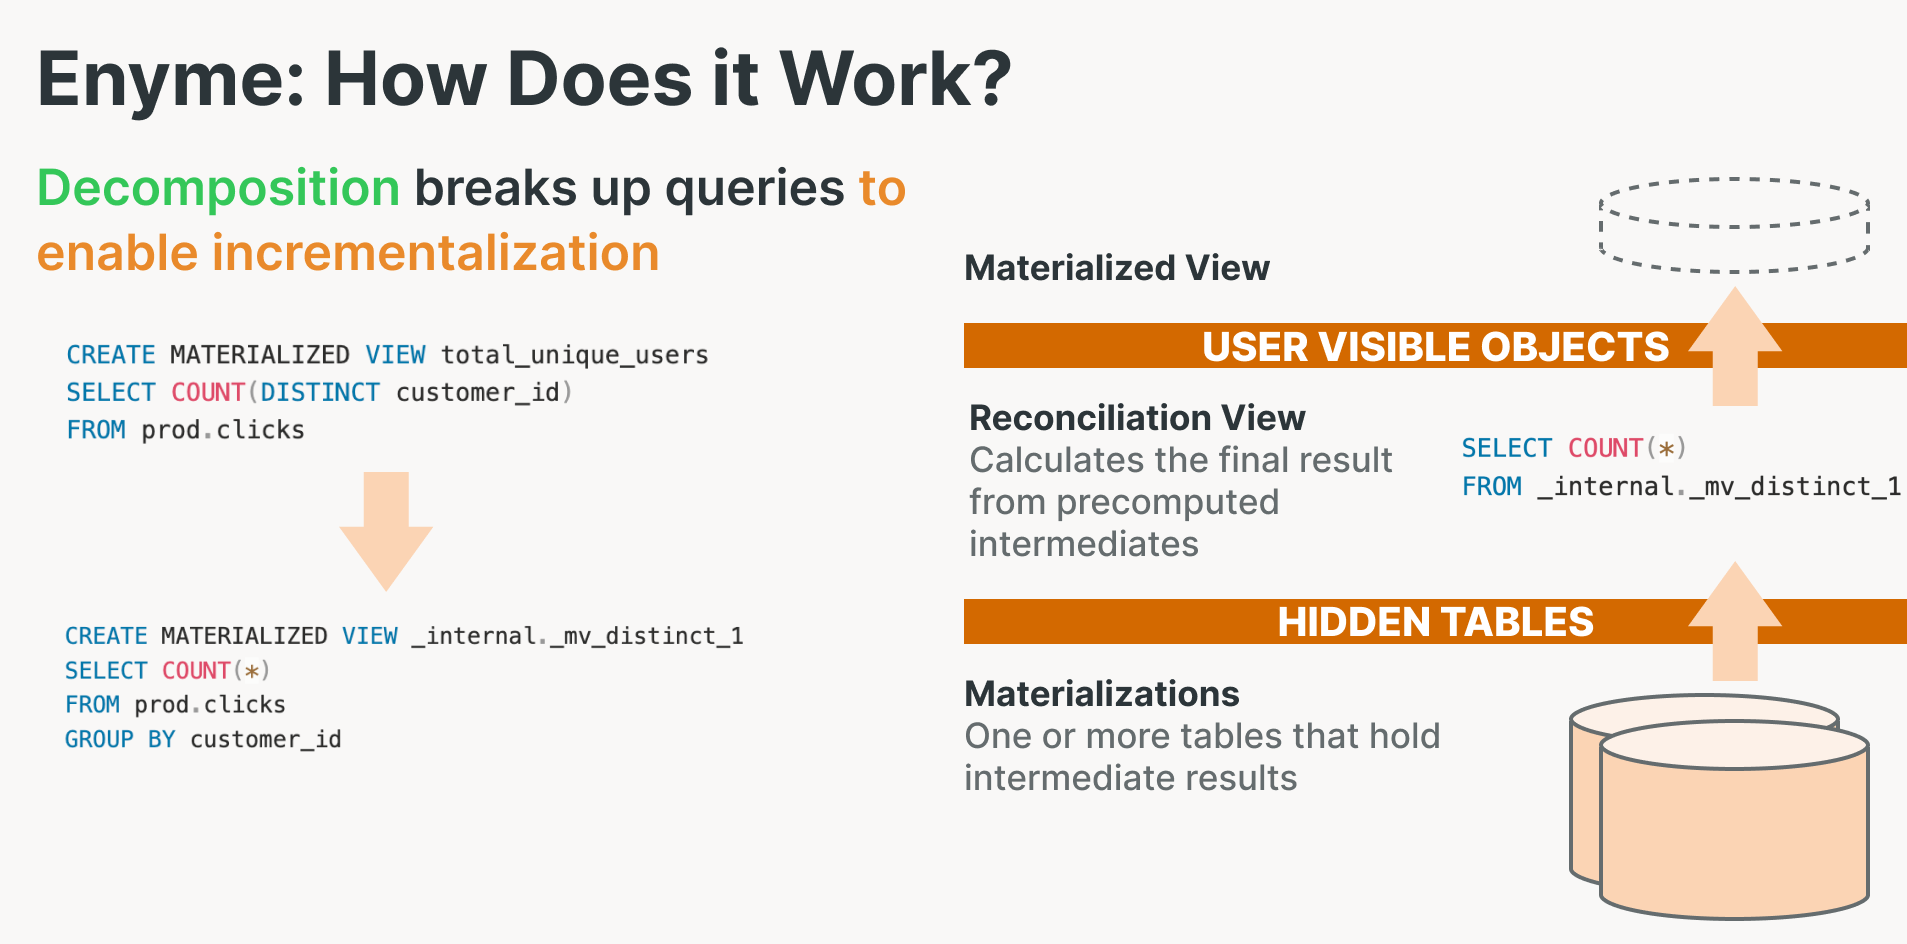
"Is it just another Delta table?” Yes and no. While materialized views use Delta format (so you can consume them however you want), they're powered by Enzyme, Databricks' secret weapon for intelligent incremental updates.
How to create a Materialized view on SQL Warehouse
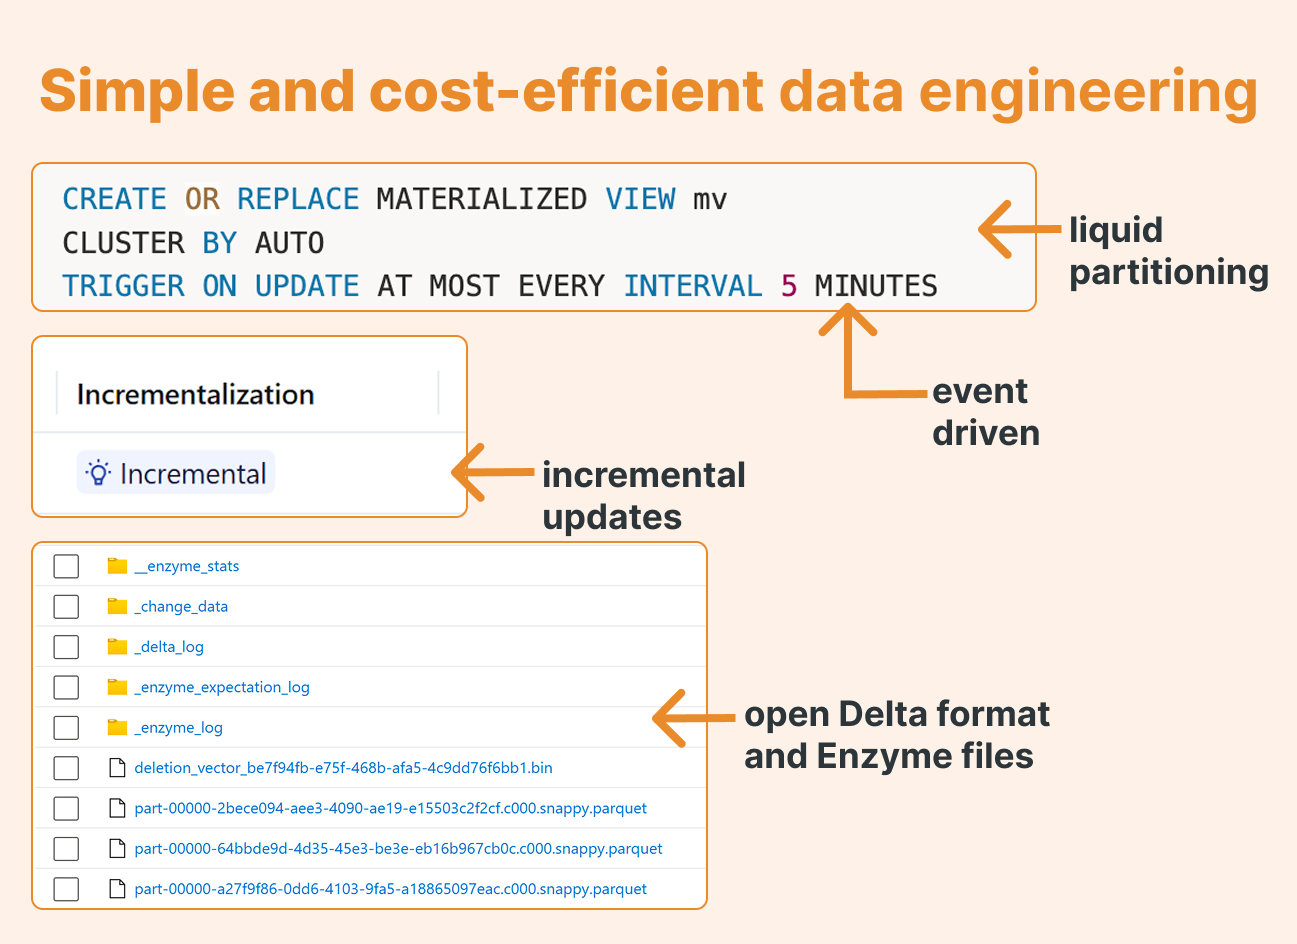
Here's how simple it is to create a production-ready materialized view on SQL Warehouse:
CREATE OR REPLACE MATERIALIZED VIEW mv
CLUSTER BY AUTO
TRIGGER ON UPDATE AT MOST EVERY INTERVAL 5 MINUTES
AS
SELECT
  customer_id,
  DATE(order_ts) AS order_date,
  SUM(amount) AS total_amount,
  COUNT(*) AS order_cnt
FROM
  orders
GROUP BY
  customer_id,
  DATE(order_ts);
That's it. You've just created a self-updating, incrementally-refreshing data transformation that runs on Databricks' most cost-effective compute.
Ensuring Incremental Processing
If our data is append-only or there are no complex changes, Enzyme will process it incrementally by default. If we are, for example, updating sources, a best practice is to enable row tracking so that every row in our Delta has a unique ID, which remains unique after an update or a deleted operation, and it’s included in the _metadata fields. Even better, add CDF. Just note that it can double the size of your Delta files.
CREATE OR REPLACE TABLE orders (
  ...
) TBLPROPERTIES (
  delta.enableRowTracking   = true, -- row tracking
  Delta.enableChangeDataFeed = true
);
Monitor Incrementality (this is critical!)
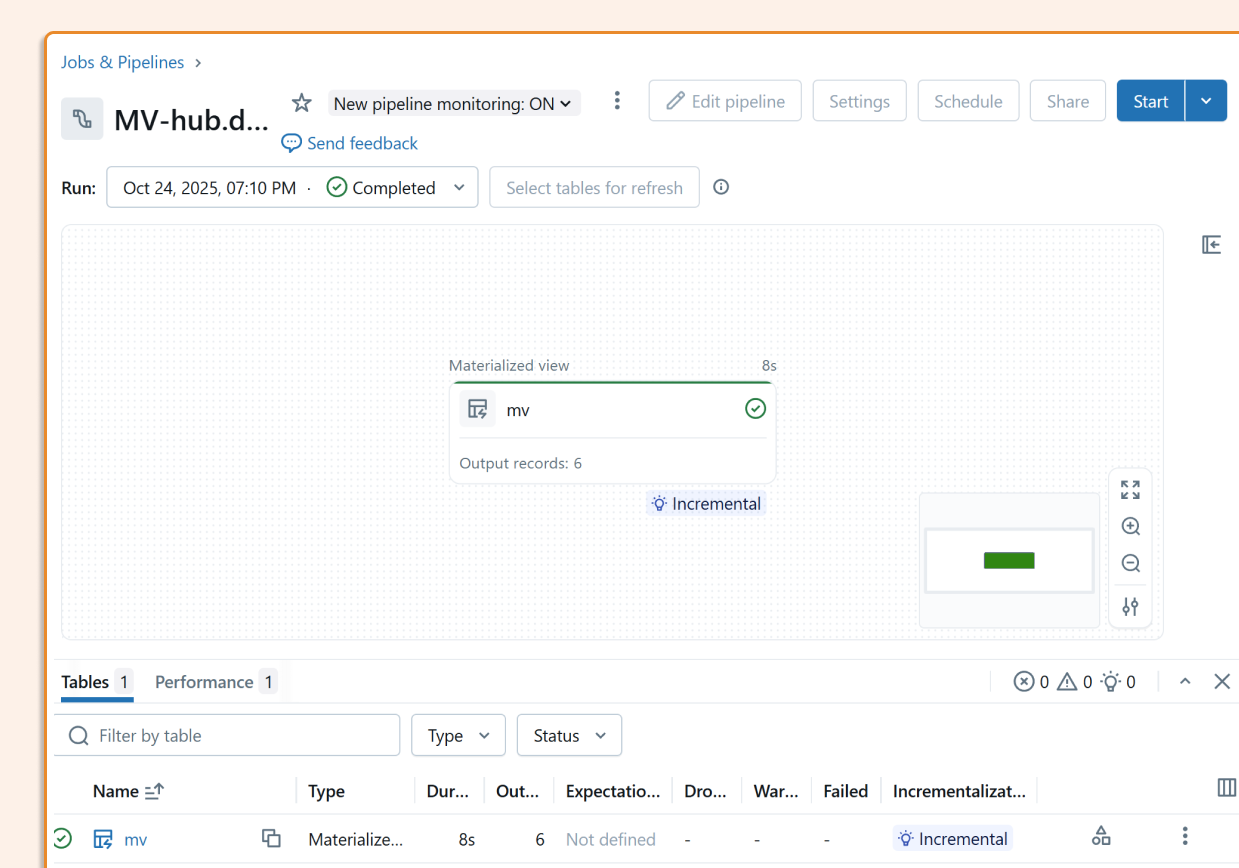
The worst-case scenario is your "incremental" view silently falling back to FULL RECOMPUTES. Catching this is made easier by Materialized Views being visible in pipelines. Here's how to do it:
Option 1: Materialized views appear in your Databricks pipelines UI
Option 2: Programmatic Monitoring. We can also do it programmatically using the event_log function.
SELECT timestamp,
       message
FROM event_log(TABLE(mv))
WHERE event_type = 'planning_information'
ORDER BY timestamp DESC LIMIT 1;

The hidden gems (features) that make the difference
1. Automated Liquid Clustering
Yes, it is supported. Your data is automatically organized for optimal query performance.
CLUSTER BY AUTO
2. Event-Driven Updates
TRIGGER ON UPDATE AT MOST EVERY INTERVAL 5 MINUTE
Even driven architecture has never been simple.
3. Open Format With Surprises
Running DESCRIBE EXTENDED mv reveals the storage location
DESCRIBE EXTENDED mv;
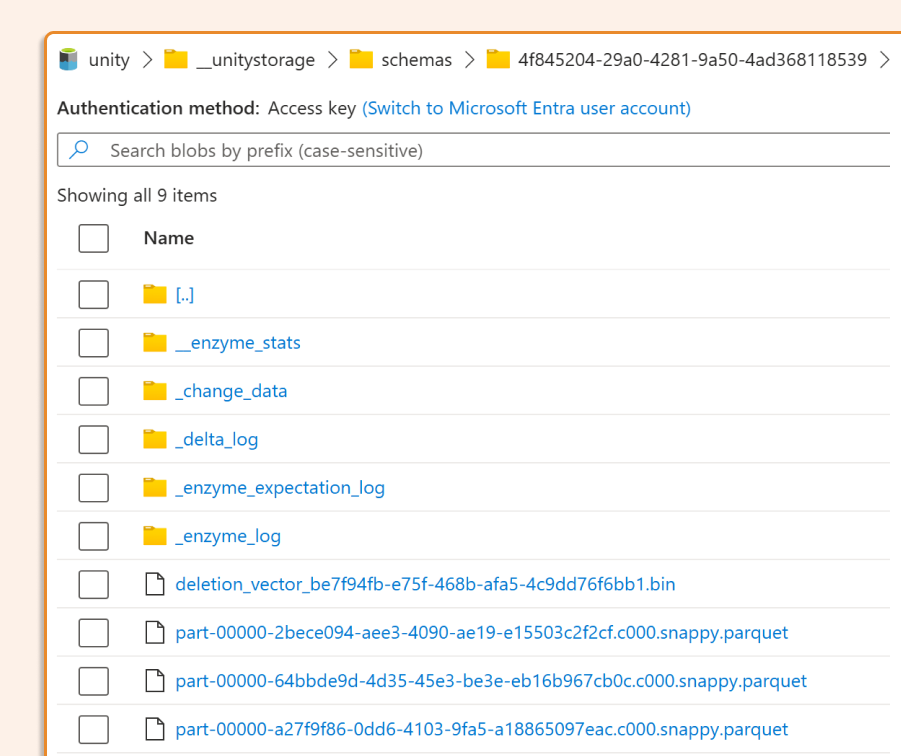
Here in our Delta, we see a few additional folders related to _enzyme stats, which are used for incremental processing. We can also see a folder with a change data feed, so other MATERIALIZED VIEWS can also consume our views incrementally.
Complex Queries
The biggest overkill is complex queries. Enzymes try to split them into incremental steps, but my advice is usually to keep your queries short and create additional layers of transformation, as this also makes it easier for human minds to understand / document.
The bottom line: cost efficiency
After extensive production use, I can confidently say that incremental materialized views and streaming tables are the most cost-effective data engineering solution in Databricks (when they run incrementally). They’re simple to create, easy to manage, and automatically optimize for performance.